


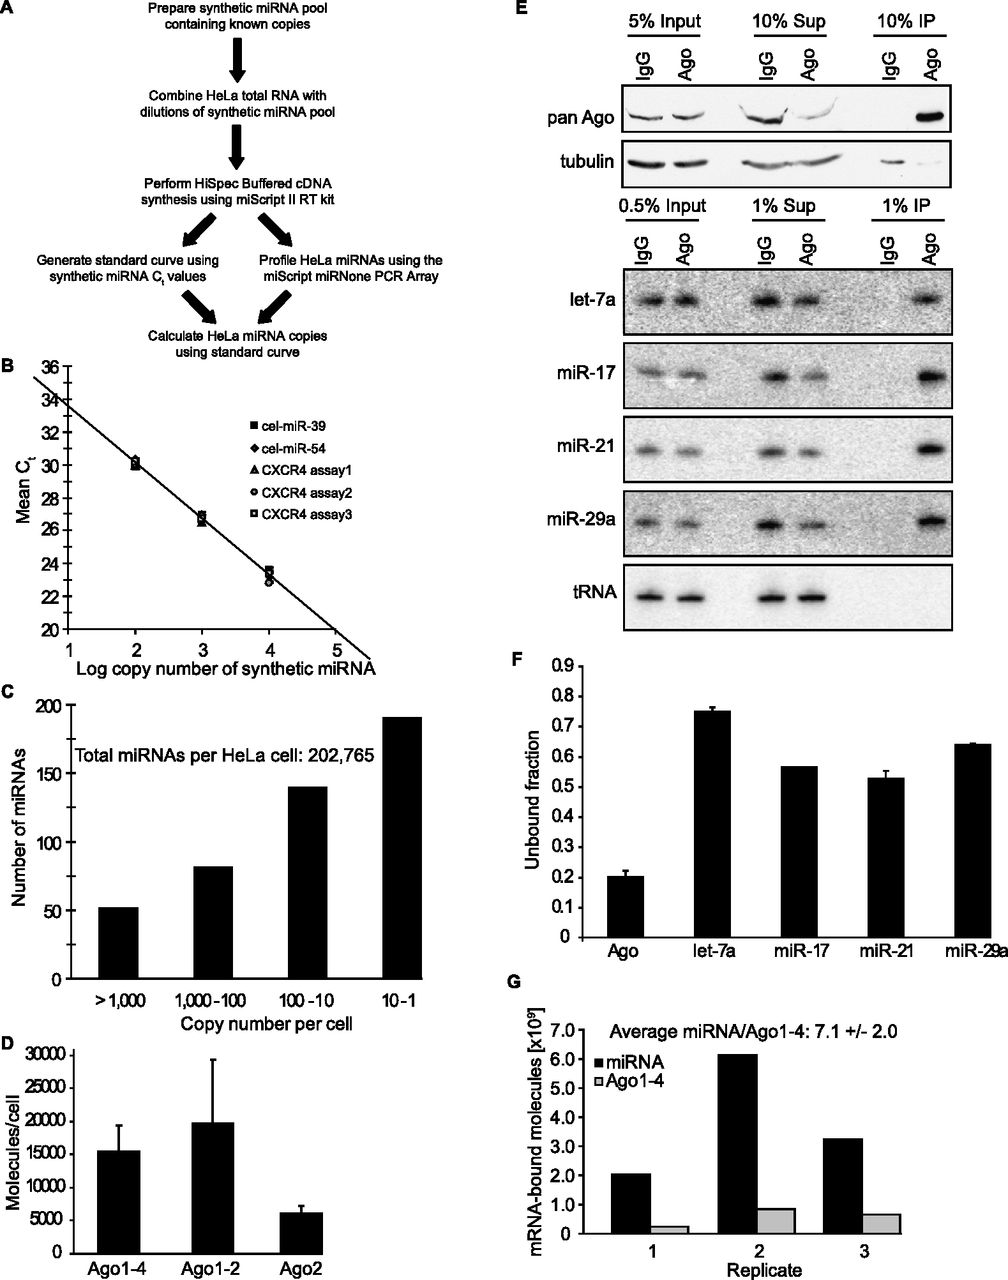
Absolute copy number quantitation and Ago binding of HeLa miRNAs. (A) Workflow used to determine absolute miRNA copy numbers per HeLa cell. A pool containing equal copies of three synthetic miRNAs (cel-miR-39, cel-miR-54, and CXCR4 miRNA) was prepared. Next, three experimental samples were prepared, each with a fixed amount of total RNA isolated from HeLa cells and an increasing copy numbers of the synthetic miRNA pool (either 5.2 × 10⁶, 5.2 × 10⁵, or 5.2 × 10⁴ copies per synthetic miRNA). cDNA samples were diluted to 1 ng/μL HeLa cDNA and either 1 × 10⁴ copies/μL, 1 × 10³ copies/μL, or 1 × 10² copies/μL of each synthetic miRNA and used as templates in real-time PCR. The resulting Ct values for the synthetic miRNAs were used to generate a standard curve to calculate endogenous miRNA copy number. For profiling of endogenous miRNAs expressed in HeLa cells, the remaining diluted cDNA samples were combined and used as a template in real-time PCR with the Human miRNome miScript miRNA PCR Array. The full experiment, from cDNA synthesis to real-time PCR, was performed in triplicate. The copy number for each miRNA expressed in HeLa cells was individually calculated using the mean Ct values for the endogenous miRNA and the experimentally determined amount of total RNA (35 pg) found in a single HeLa cell (Supplemental Fig. S1A). (B) miScript Ct values directly correspond to miRNA copy numbers independently of primer set sequences. The Ct values obtained from the real-time PCR assays targeting the synthetic miRNAs were plotted against the copy number of the synthetic miRNAs present in the real-time PCR reaction. The equation generated from the averaged synthetic Ct values was y = −3.4386x + 37.011 with R2 = 1. (C) Distribution of miRNA copy numbers for HeLa cells. Absolute copy numbers were binned and charted, demonstrating the range of miRNA expression in HeLa cells. A total of 669 different miRNA species were detected, and the total number of miRNA molecules per HeLa cell was determined to be 202,765. (D) Absolute quantitation of Ago molecules per HeLa cell using tandem mass spectrometry and synthetic isotope-labeled Ago peptides as internal standards that mimic native peptides formed by proteolysis. Known numbers of HeLa cells were lysed, and separated on a Coomassie gel. Proteins were extracted from the 85–110 kDa gel fragment containing Agos, spiked with synthetic Ago peptides (covering Agos1–4, Ago1–2, and specific to Ago2) and analyzed on a Thermo Orbitrap XL2 LCMS. Integrated peak areas around heavy (spiked Ago peptides) and light (endogenous Ago peptides) peaks were used for quantitation. (E) A large fraction of miRNAs exist in an Ago-free form in cells. Ago1–4 were depleted with the anti-pan Ago antibody, and the indicated fractions of inputs, supernatants, and precipitates either were Western blotted for Ago1–4 (with the anti-pan Ago) and normalized to tubulin or were Northern blotted for four abundant HeLa miRNAs (let-7a, miR-17, miR-21, and miR-29a) and normalized to tRNA. (F) Quantitation of the fraction of Ago1–4 and miRNAs left in the unbound supernatant fraction after anti-pan Ago IPs showed in E. Whereas 80% of Ago1–4 was depleted, only as much as 50% of a given miRNA species was codepleted, indicating that at least 30% of a given miRNA population is Ago-free. (G) mRNAs are associated with a sevenfold excess miRNA molecules relative to Ago1–4 molecules. Polyadenylated HeLa mRNAs were pulled down with oligo(dT) dynabeads, and absolute numbers of miRNA and Ago1–4 molecules were quantified as in C and D, respectively. To control for nonspecific binding, parallel pulldowns were performed with Streptavidin dynabeads. Bar graphs, mean ± SD from three independent experiments.




