


NMR structure of a 4 × 4 nucleotide RNA internal loop from an R2 retrotransposon: Identification of a three purine–purine sheared pair motif and comparison to MC-SYM predictions
- Yelena V. Lerman1,
- Scott D. Kennedy2,
- Neelaabh Shankar2,
- Marc Parisien3,
- Francois Major3 and
- Douglas H. Turner1,4
- 1Department of Chemistry, University of Rochester, Rochester, New York 14627, USA
- 2Department of Biochemistry and Biophysics, University of Rochester School of Medicine and Dentistry, Rochester, New York 14642, USA
- 3Department of Computer Science and Operations Research, University of Montreal, Montreal, Quebec H3C CJ7, Canada
Abstract
The NMR solution structure is reported of a duplex, 5′GUGAAGCCCGU/3′UCACAGGAGGC, containing a 4 × 4 nucleotide internal loop from an R2 retrotransposon RNA. The loop contains three sheared purine–purine pairs and reveals a structural element found in other RNAs, which we refer to as the 3RRs motif. Optical melting measurements of the thermodynamics of the duplex indicate that the internal loop is 1.6 kcal/mol more stable at 37°C than predicted. The results identify the 3RRs motif as a common structural element that can facilitate prediction of 3D structure. Known examples include internal loops having the pairings: 5′GAA/3′AGG, 5′GAG/3′AGG, 5′GAA/3′AAG, and 5′AAG/3′AGG. The structural information is compared with predictions made with the MC-Sym program.
Keywords
INTRODUCTION
Free-energy minimization with restraints from sequence comparison (Luck et al. 1996; Hofacker et al. 2002; Mathews and Turner 2002; Havgaard et al. 2005; Reeder and Giegerich 2005), chemical mapping (Mathews et al. 2004; Deigan et al. 2009; Watts et al. 2009), NMR (Hart et al. 2008), and a combination of those methods (Kierzek et al. 2009; Mathews et al. 2010) is allowing rapid determination of RNA secondary structures. Determination of RNA three-dimensional structures, however, remains difficult (Moore 1999; Doherty and Doudna 2001). To compensate for the difficulty in determination of three-dimensional structures, various methods are being devised to model them from sequence. The methods include homology modeling aided by human intuition (Martinez et al. 2008; Westhof et al. 2010), and/or knowledge-based course force fields (Malhotra and Harvey 1994; Tan et al. 2006; Das and Baker 2007; Ding et al. 2008; Parisien and Major 2008; Jonikas et al. 2009; Parisien et al. 2009; Das et al. 2010; Pasquali and Derreumaux 2010), and/or low-resolution experimental data, and/or bioinformatics data (Gherghe et al. 2009; Flores and Altman 2010; Yang et al. 2010; Seetin and Mathews 2011). There are relatively few benchmarks available, however, for testing and optimizing these methods, especially all atom methods. NMR structures of small RNA internal loops in solution (SantaLucia and Turner 1993; Wu and Turner 1996; Heus et al. 1997; Butcher et al. 1999; Schmitz et al. 1999a,b; Znosko et al. 2002; Chen et al. 2005, 2006, 2007; Shankar et al. 2006, 2007; Tolbert et al. 2007) provide benchmarks for the full range of methods. Comparisons with predictions are straightforward because the structures depend only on interactions within the RNA and between the RNA and solvent. Here, the NMR structure is reported of a 4 × 4 nucleotide internal loop from an R2 retrotransposon (Kierzek et al. 2009). Comparisons with previous structures (Ban et al. 2000; Carter et al. 2000; Pioletti et al. 2001; Chen et al. 2005, 2006; Kazantsev et al. 2005; Schuwirth et al. 2005; Korostelev et al. 2006; Harms et al. 2008) reveal a common motif for three purine–purine sheared pairs.
R2 retrotransposons insert their sequence into a host genome by a target-primed reverse transcription mechanism that relies on the R2 protein (Luan et al. 1993). Such retrotransposons are common in arthropods. The internal loop studied here (Fig. 1) is found in the R2 retrotransposon RNA from Bombyx mori (Kierzek et al. 2008, 2009) and occurs in a 320-nucleotide fragment that tightly binds one copy of R2 protein (Christensen et al. 2006). The loop is near the leading edge of a 41-nucleotide RNA hairpin that has a conserved secondary structure and codes for a region of partially conserved amino acids in the R2 protein (Kierzek et al. 2009).
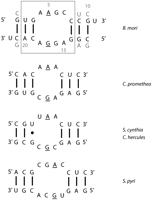
(Top) Internal loop studied in this work. Boxed region is identical to natural sequence from B. mori. Nucleotides above and below duplex are a natural sequence that was changed for this study. (Bottom) Sequences of loops in Callosamia promethea, Samia cynthia, Coscinocera hercules, and Saturnia pyri (Kierzek et al. 2009). Nucleotides potentially in an AG pair are underlined.
As shown in Figure 1, the R2 internal loop potentially contains an AG pair, but the other nucleotides are not conserved in related internal loops in four other silk moth species (Kierzek et al. 2009). Isostericity matrices (Leontis et al. 2002) do not suggest a common folding for the four known sequences. The sequence of the B. mori internal loop is also not found in known three-dimensional structures of RNA, and there is no three-dimensional structural information available for retrotransposons. There are many potential three-dimensional structures for the B. mori internal loop, however. For example, the internal loop could form three consecutive AG pairs and a bulged C and A on opposite sides of the loop. Motifs with three consecutive AG pairs can be very stable (Chen and Turner 2006). Alternatively, sheared AA and AG pairs (trans Hoogsteen/sugar edge AA or AG, abbreviated tH/S AA or AG) could form adjacent to an N1-carbonyl, N7-amino (trans Watson–Crick/Hoogsteen, abbreviated tWC/H) GG pair (Burkard and Turner 2000) and a cis Watson–Crick/Watson–Crick (cWC/WC) protonated CA pair (Legault and Pardi 1997). Many other possibilities exist. Thus, the structure provides a new benchmark for testing methods of predicting local three-dimensional structures. The structure is compared with predictions generated by the MC-Sym program (Parisien and Major 2008).
RESULTS
Thermodynamics
The thermodynamic stability of the duplex studied by NMR (Fig. 1) was measured by optical melting in 1 M NaCl at pH 6.5 and pH 5.0 (Table 1). The values of ΔG37° from TM−1 vs. log CT plots are −7.04 ± 0.14 and −7.03 ± 0.24 kcal/mol, respectively, at pH 6.5 and pH 5.0. Thus, there is no thermodynamic evidence for protonation of the duplex, which might be seen with certain CA pairs (Chen et al. 2009). Values of ΔH° from TM−1 vs log CT plots and from fitting melting curves differ by 4% and 19% at pH 6.5 and pH 5.0, respectively, consistent with two-state and not quite two-state melting, respectively.
Thermodynamic parameters for duplex formation by 5′-GUGAAGCCCGU/3′-UCACAGGAGGC
The free-energy increment at 37°C attributable to the loop is 0.57 kcal/mol as calculated from Gralla and Crothers (1973):
Here, the value for the duplex without an internal loop is calculated from nearest-neighbor parameters (Xia et al. 1998; Burkard et al. 1999; Turner 2000). The current model for predicting the free-energy increment for internal loops (Mathews et al. 2004) predicts 2.21 kcal/mol at 37°C. Evidently, this internal loop is unusually stable.
Exchangeable proton spectra
Figure 2 shows 1D imino proton, 2D SNOESY, and 1H-15N HSQC spectra for the duplex at pH 6.5 and 0°C. The spectra confirm five of the expected six Watson–Crick base pairs and provide the assignments shown in Figure 2. The imino peaks for Watson–Crick pairs were confirmed by typical NOE connections to cytosine amino and H5 and H6 protons for GC pairs and to adenine H2 protons for AU pairs. No imino resonance is observed at pH 6.5 for the terminal base pair formed by G10, presumably due to fast exchange with water. At pH 5.2, however, a broad resonance at 12.65 ppm is attributed to G10 with typical NOE connections to C12 amino and H5/H6 protons (data not shown). Pronounced resonances attributable to the non-Watson–Crick paired nucleotides G6, G16, G17, and U22 are also observed at pH 6.5 (Fig. 2). G17 is assigned by cross-peaks to A4H2 and H8. G16 is distinguished from G6 by a cross-peak to A5H8. U22 is identified as a uracil by the chemical shift of N3 and is assigned by cross-peaks to C21 aminos and to U22H5. No peak is identified for U11.
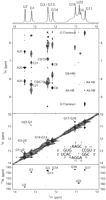
NMR spectra of the internal loop from B. mori R2 retrotransposon 5′RNA in 90:10 (v/v) H2O:D2O at 0°C and pH 6.5. The imino proton region is shown. At top is the 1D spectrum; the middle presents two regions of a 2D SNOESY spectrum (mixing time = 100 msec); at bottom is a proton-nitrogen HSQC spectrum. The 22-mer model duplex is shown in the inset.
The different behavior of the two 3′-dangling end U's and their adjacent GC pairs is consistent with free-energy increments (Xia et al. 1998; Turner 2000), which predict that the equilibrium constants for hydrogen-bond formation and for stacking of the 3′-dangling end U on each end will be different at 0°C. In particular, the predicted difference in free energy at 0°C between formation of a terminal GC base pair and a 3′ unpaired C for 5′GU/3′CA is −3.34 + 0.57 = −2.77 kcal/mol, corresponding to an equilibrium constant of 164.6, leaving only 0.6% unpaired G. In contrast, the predicted difference between a terminal GC base pair and a 3′ unpaired G for 5′CG/3′GC is −3.35 + 2.54 = −0.81 kcal/mol, corresponding to an equilibrium constant of 4.45, leaving 18% unpaired G. Both calculations ignore stacking of a 5′ dangling end nucleotide, which is predicted to be negligible (Turner 2000). Different stacking of the 3′ dangling end U's may also contribute to a different exchange with water at the two ends. Equilibrium constants for stacking of a 3′ dangling end U on a C or G will be roughly 35 and 6, respectively, at 0°C (Turner 2000), corresponding to 97% and 86% stacked on the adjacent base pair. Thus, the terminus with U22 is predicted to be folded more tightly than that with U11. Evidently the tighter folding protects G1H1 and U22H3 from exchange with water. The broad signal near ∼11.3 ppm is largely from all imino protons of a single RNA strand present in slight excess over the other strand.
Nonexchangeable proton spectra
Figure 3 shows a 2D NOESY spectrum at pH 6.5 and 20°C. As shown in Figure 3, the backbone NOESY walk is similar to A-form RNA through both strands except near G17, where the cross-peak connecting G17H8 with G16H1′ is very weak due to a weak G17H8-G16H2′ cross-peak. The latter eliminates spin diffusion through H2′. A 1H-13C HSQC spectrum at pH 5.5 does not show a shifted adenine C2 resonance, which would be expected if a protonated adenine was present (Legault and Pardi 1997; Ravindranathan et al. 2000). A 1H-31P HETCOR spectrum shows that the resonance for the phosphorus between G17 and A18 is shifted downfield by ∼3 ppm relative to the other 31P resonances. TOCSY and DQF-COSY spectra and 7 Hz splitting of G17 H1′ indicate that the G17 ribose is primarily in the C2′-endo conformation. The Supplemental Material includes tables of assignments and distance restraints deduced on the basis of the spectra.
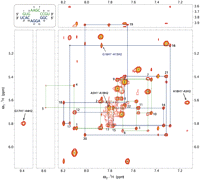
2D NOESY spectrum of the R2 internal loop in 100% D2O at 20°C showing the H8/H6/H2H1′/H5 region. The mixing time is 400 msec. C and U H5–H6 NOEs are indicated by crosses. Important cross-strand NOEs involving adenine H2 protons are indicated in black.
Structure description
The structure was modeled on the basis of NMR restraints as described in the Materials and Methods and structure statistics are shown in Table 2. The overall structure is shown in Figure 4A and potential hydrogen-bonding patterns suggested by the model for the noncanonical pairs in the loop are shown in Figure 4B. All eight loop bases are primarily within the helix. Six bases are in a motif of three consecutive, highly stacked, sheared, or sheared-like purine–purine pairs. The remaining two bases are in a single hydrogen-bond AC pair involving the Watson–Crick faces. All glycosidic bonds are in the anti-configuration, and all ribose groups other than G17 have C3′-endo puckers. As observed in other sheared pairs, the helix becomes substantially narrower in the center of the loop. For all 40 calculated structures, the average C1′ to C1′ distance in the stems is 10.7 ± 0.09 Å, while the distance is 9.4 ± 0.4 Å at the AA pair, 9.0 ± 0.09 Å at the AG pair, 9.6 ± 0.47 Å at the GG pair, and 10.5 ± 0.24 Å at the CA pair. The noncanonical pairs are described below along with NMR evidence for them.
NMR structure statistics for the duplex 5′GUGAAGCCCGU/3′UCACAGGAGGC from the R2 retrotransposon 5′RNA
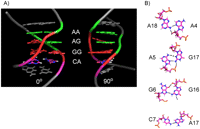
(A) Representative model of the internal loop, 5′AAGC/3′AGGA, from the B. mori R2 retrotransposon 5′ RNA. Loop residues are shown in color, and closing pairs are shown in gray. The AA, AG, GG, and CA pairs can be described in the Leontis-Westhof notation as S/H, H/S, H/S, and W/W, respectively. (B) The structures of the four pairs of the B. mori R2 internal loop in the NMR model. The pairs are shown down the axis of the helix without rotation of the duplex about the long axis. Short dashed lines connect potential hydrogen-bond donors and acceptors that are within 2.2 Å in the modeled structures. Long dashed lines connect potential hydrogen-bond donors and acceptors that are >2.5 Å apart. The dotted line from G16H1 goes to a nonbridging oxygen between A4 and A5. As discussed in the text, the G6 and G16 base pair may exchange with similar conformations.
The A4–A18 and A5–G17 pairs each have a sheared conformation (trans Hoogsteen/Sugar edge) as illustrated in Figure 4B. Consistent with this structure are the following NMR signatures expected for a trans Hoogsteen/Sugar sheared AA or GA pair adjacent to a trans Sugar/Hoogsteen sheared purine–purine pair (SantaLucia and Turner 1993; Heus et al. 1997; Znosko et al. 2002; Chen et al. 2005, 2006): (1) the C19H1′ resonance is upfield shifted to 3.93 ppm (Fig. 5) and there is a medium NOE cross-peak between C19H1′ and A18H2; (2) there is an A4H2/A18H8 cross-peak, but no A4H8/A18H2 cross-peak; (3) there are strong A4H2/G17H1′, A5H2/A18H1′, and A18H2/A5H1′ cross-peaks corresponding to distances of 3.1, 3.2, and 2.9 Å, respectively, indicating a narrow minor groove, because these distances are expected to be at least 9.5, 3.7, and 3.7 Å, respectively, for A-form RNA; (4) there is a strong cross-peak from G17H22 (amino) to A5H8. Moreover, one resonance from the G17 amino group is at 9.3 ppm, which indicates hydrogen bonding consistent with a G17–A5 sheared pair (Fig. 4B), and the downfield chemical shift of A4H2 to 9.4 ppm (Fig. 5) is expected due to the ring current effect from A18.
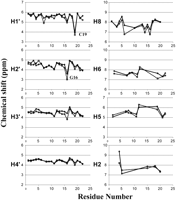
Observed (solid) and predicted (dashed) chemical shifts of each atom type plotted against residue number. Predicted shifts were calculated with the program NUCHEMICS (Wijmenga et al. 1997; Cromsigt et al. 2001) using the ensemble of 10 accepted structures.
While the A4–A18 and A5–G17 pairs are both sheared, they differ in that the AA pair is relatively planar, whereas the AG pair has substantial twist (Fig. 4A). The orientation of the G17 base places G16H2′ directly under the aromatic rings and results in an upfield chemical shift of G16H2′, which is predicted by the program NUCHEMICS (Fig. 5; Wijmenga et al. 1997; Cromsigt et al. 2001). The twist is, at least in part, a result of the backbone distortion required to accommodate the adjacent sheared GG base pair (see below). The backbone distortion includes a C2′-endo G17 sugar pucker and G17 ζ dihedral of ∼180° instead of the usual A-form value of −71°. There is precedent for C2′-endo sugar puckers for G nucleotides in sheared GA pairs when they are not flanked by CG or UG wobble pairs (Heus et al. 1997; Chen et al. 2005, 2006; Tolbert et al. 2007).
The G6–G16 pair is the least well defined by the NMR spectra. A cross-peak to A5H8 from G16H1 indicates that G16 reaches across the helix. Medium cross-peaks from G16H1 to G17 imino and amino protons also help place G16. There is a weak G6H8/G16H1 cross-peak that is consistent with spin diffusion in the one hydrogen-bond base–base amino–N7 GG pair shown in Figure 4B. Also consistent with this pairing is the lack of NOEs to the G6 imino proton, with the exception of weak cross-peaks to C7H1′ and A5H2. This pairing is not definitive because an expected NOE from G16 amino protons to G6H8 and a downfield shift of a G16 amino as expected for a hydrogen bond are not observed. It is possible that the hydrogen bond is not formed and no G16 amino—G6H8 cross-peak is observed because both of these resonances are broad and the expected cross-peak is obscured by stronger, nearly overlapping cross-peaks. The pairing in Figure 4B is similar to the trans Hoogsteen/Sugar Edge classification (Leontis et al. 2002). Of the 40 calculated structures, three show a slightly different pairing in which the G16 amino forms a hydrogen bond or close electrostatic interaction with the carbonyl oxygen of G6 instead of N7. The NMR data does not distinguish between these two pairing options, and it is reasonable to expect exchange between them or other similar conformations. Such exchange could contribute to lack of NMR signatures expected for the GG structure in Figure 4B.
Another observation consistent with the modeled conformation of the G6–G16 pair is that the chemical shift of G16H2′ is unusual (3.61 ppm) and is nearly identical to that observed for the equivalent proton in 5′CGAAG/3′GAGGU (3.61ppm), 5′CGAAA/3′GAGGU (3.62ppm), and 5′CGAAG/3′GAAGU (3.67 ppm) (Chen et al. 2005, 2006). The stacking of G16 under G17 must be very similar to the stacking of sheared pair on sheared pair seen in these other structures as this ∼0.8-ppm upfield shift is critically dependent on the position of G16H2′ relative to the ring of G17.
The C7–A15 pair has a cis Watson–Crick/Watson–Crick conformation with one hydrogen bond (Fig. 4B). The pH dependence of thermodynamics, the imino proton spectra, and a 1H-13C HSQC spectrum provide no evidence of a protonated C or A. The NOE spectra, however, show a cross-peak between A15H2 and a C7 amino hydrogen with a chemical shift consistent with involvement in a hydrogen bond. This suggests the pairing shown in Figure 4B.
Generation of alternative structures with MC-SYM
The density of protons in RNA is limited, and force fields for RNA are less developed than those for proteins (Banas et al. 2010; Yildirim et al. 2010). Thus, it is possible that folds different from the one described above could also satisfy all the NMR restraints. The MC-Sym program (Parisien and Major 2008) was used to search for potential alternatives. The models generated by MC-Sym contained many different base-pairing types, and probabilities were assigned according to their frequencies and flanking contexts in known structures. Table 3 shows the top 10 base-pairing suites for the duplex out of 88 generated. Here “suite” refers to the order and type of base pair as categorized by Leontis et al. (2002). The most probable suite is observed in 611 structures of the 10,000 generated, but only has the GG and CA pairings deduced by NMR. The suite that fits all of the pairings deduced by NMR ranks third, with a predicted probability of 0.09. On the basis of AMBER energy calculations, the pairings deduced from NMR are also not predicted to be optimal. The pairing suite deduced from NMR was identified, however, when 22 easy-to-obtain NMR restraints (NMR-22) in the interior loop of the duplex were used. An easy-to-obtain subset of 79 NMR restraints (NMR-79) for the whole duplex blurs the selection, however. Finally, the full set of NMR restraints (NMR-229) reconfirms the selection of the correct base-pairing suite.
Base-pairing suite determined by NMR (0) and top 10 suites predicted by MC-SYM (1–10) without NMR restraints
Figure 6A compares the NMR structure with the unrestrained MC-Sym structure with the correct base-pairing suite and the lowest RMSD with the NMR-solved structure (1.24 Å). This MC-Sym structure, however, does not minimize the NMR loop violations. The two MC-Sym structures that minimize the NMR loop violations when using NMR-22 have 1.52 (Fig. 6B) and 2.73 Å of RMSD with the NMR-solved structure; the one that minimizes the violations using NMR-79 has 1.72 Å RMSD; similarly, NMR-229 (see Supplemental Table SM1) gives 1.72 Å RMSD. The MC-Sym structure with the lowest energy as evaluated by AMBER has 2.73 Å of RMSD with the NMR-solved structure. Thus, the MC-Sym approach with NMR restraints confirms the NMR structure and does not find an alternative structure. Presumably, accurate MC-Sym modeling of structure will require less and less experimental restraints, as the database of 3D structures expands and as force fields improve.
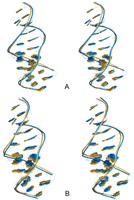
Stereoviews of two MC-Sym models (blue) superimposed with the NMR-solved structure (yellow). Cylinders thread through the phosphate atoms. (A) MC-Sym model with the best RMSD (1.24 Å) to the NMR-solved structure. (B) MC-Sym model with the lowest NMR loop violations (RMSD of 1.52 Å).
DISCUSSION
Three-dimensional modeling of protein structures is very successful (Baker and Sali 2001; Das et al. 2007), but three-dimensional modeling of RNA is not nearly as well developed. This is partly due to the much smaller database of RNA structures. The internal loop structure reported here occurs in the coding region of a retrotransposon and thus represents a structure from a class of RNA not previously studied structurally.
The internal loop contains a sheared (tSH) AA pair stacked on a sheared (tHS) AG pair. This motif of stacked, tandem-sheared, purine–purine pairs is common (SantaLucia and Turner 1993; Gautheret et al. 1994; Tan et al. 2006). However, the twist of the A5G17 pair is unusual and suggests that the detailed conformation of such pairs depends on context. It may be the result of the C2′-endo sugar pucker of G17 and of backbone distortions (G17 ζ dihedral ∼180°; A-form ζ∼ −71°; A18 β∼149°; A-form β∼174°) apparently required to accommodate the conformation of the following sheared (tHS) G6G16 pair. Altered sugar and backbone conformations have been seen in the 5′G of similar tandem sheared pairs. For instance, in cases where a tandem-sheared GA pair is flanked by a residue 5′ of the G that is in a non-Watson–Crick anti-parallel pair involving its sugar edge (placing it in the major groove), the G takes on the C2′-endo sugar conformation (Chen et al. 2005, 2006; Tolbert et al. 2007).
Because the C7A15 pair of this 4 × 4-nt loop forms an approximately Watson–Crick (cWW) pair, the structure is perhaps better described as a 3 × 3 loop of consecutive purine–purine sheared pairs. As shown in Figure 7, the motif reported here for 5′AAG/3′AGG is strikingly similar to that formed by three tandem GA pairs, 5′GAA/3′AGG, in the NMR structure of an isolated internal loop (Chen et al. 2005, 2006). In each case, tandem-sheared pairs interacting with faces S/H and H/S are followed by another H/S sheared pair. The backbone follows a more or less A-form path between the first two pairs, but a sharp turn required to accommodate the second H/S pair apparently causes the G ribose of the central AG to be C2′-endo. This same structural motif is also found in at least 12 occurrences of the loop, 5′GAA/3′AGG, within crystal structures of ribosomes (Ban et al. 2000; Schuwirth et al. 2005; Korostelev et al. 2006; Harms et al. 2008; Weixlbaumer et al. 2008). Nine of these occurrences have unique closing base pairs and three form the NC stem of kink-turns (Klein et al. 2001).
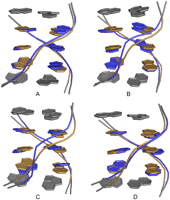
Comparison of B. mori R2 loop (gold) (5′GAAGCC/3′CAGGAG) with other loops (blue) consisting of three sheared purine–purine pairs. (A) 5′CGAAG/3′GAGGU (Chen et al. 2005), (B) 5′UGAAG/3′AAGGU (Ban et al. 2000), (C) 5′UGAGG/3′GAGGU (Schuwirth et al. 2005), and (D) 5′UGAAG/3′GAAGC (Chen et al. 2006). Closing pairs are shown in gray, including the CA pair in the R2 loop. Structures were aligned by pair-fitting of six C1′ atoms in the loop residues.
At least two other loops have the structural motif described above. These include both the major and minor structure observed for the internal loop, 5′GAA/3′AAG (Chen et al. 2006), and the loop, 5′UGAGG/3′GAGGU, found in the bacterial 50S subunit (Schuwirth et al. 2005). The latter is of particular interest as it contains a GG sheared pair similar to and in the same position as the GG pair in the R2 loop. Thus, the structural motif contains 3 × 3 nt loops comprised entirely of purine–purine sheared pairs. These include 5′GAA/3′AGG, 5′GAG/3′AGG, 5′GAA/3′AAG, and here, 5′AAG/3′AGG. We call this the 3RRs motif, where R represents the purines, A and G, and s represents “sheared.” The presence of this loop motif in both NMR and crystal structures indicates that it is stabilized by RNA/RNA interactions within the loop. This contrasts with the 5′CUAAG/3′GAAGC loop, where the structure in crystals of ribosomes (Harms et al. 2001; Schuwirth et al. 2005; Lee et al. 2006) is dramatically different from that in the isolated loop (Shankar et al. 2006).
Hydrogen bonds apparently contribute to the stabilities of the 3RRs motif. In the R2 NMR model, the amino group of G17 and imino hydrogen of G16 both approach a nonbridging oxygen between A4 and A5 (Fig. 8A). A similar pattern is seen in the loop with three tandem GA pairs, 5′CGAAG/3′GAGGU (Chen et al. 2005), and in 5′CGAAG/3′GAGGC (Kazantsev et al. 2005). Additionally, the force field generates a 2′OH hydrogen bond in the GG pair of the R2 RNA that is similar to one generated for the equivalent AG pair in the NMR model of 5′CGAAG/3′GAGGU (Fig. 8B). Interaction of G6 carbonyl oxygen with the cross-strand 2′-OH proton in the R2 loop, 5′AAG/3′AGG, is replaced by interaction of the adenine amino proton with the cross-strand 2′-OH oxygen in 5′GAA/3′AGG. The hydrogen bond to the G6 carbonyl avoids an “unsatisfied hydrogen bond acceptor,” which is expected to be energetically very unfavorable (Siegfried et al. 2010). Hydrogen bonds with 2′-OH groups in tertiary interactions have been shown to add ∼1 kcal/mol favorable free energy for folding (Sugimoto et al. 1989; Bevilacqua and Turner 1991; Pyle and Cech 1991).
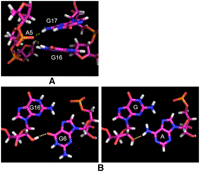
Potential hydrogen bonds or electrostatic interactions in the B. mori R2 internal loop, 5′AAG/3′AGG, and in 5′GAA/3′AGG. (A) G17 amino proton and G16 imino proton share negative charge of a nonbridging phosphate oxygen on A5. The same interaction is observed in 5′CGAAG/3′GAGGU (Chen et al. 2005), but the distances are ∼1 Å farther in 5′CGAAG/3′GAGGC (Kazantsev et al. 2005). (B) Comparison of electrostatic interactions in the G6G16 pair of the R2 loop with the equivalent AG pair in 5′CGAAG/3′GAGGU (Chen et al. 2005). Interaction of G6 carbonyl oxygen with cross-strand 2′-OH proton (left) is replaced by interaction of A amino proton with cross-strand 2′-OH oxygen.
The combination of three tandem GA pairs occurs often in RNA secondary structures (Kaine 1990; Klein et al. 2001; Cannone et al. 2002; Kazantsev et al. 2005; Chen and Turner 2006), including in size asymmetric internal loops. This suggests that the 3RRs motif may be very common. On the basis of secondary structure, particularly important cases may include internal loops in HIV, e.g., 5′UGGAA/3′GAGGGU (Daugherty et al. 2008), 5′CAGACC/3′GAGAAG (Damgaard et al. 2002), 5′CGAGG/3′GAAGC (Damgaard et al. 2002), and 5′CAGACC/3′GAGAGAG (Marchand et al. 2002).
The occurrence of the 3RRs structural motif depends on the closing pairs. For instance, in the loop 5′RGAAU/3′YAAGG all three purine–purine pairs are cis WC/WC imino paired for RY = GC or AU (Carter et al. 2000; Pioletti et al. 2001), but the sequence 5′UGAAG/3′GAAGC has three sheared purine–purine pairs (Chen et al. 2006). Interestingly, seven of eight unique 3RRs loops that are closed at both ends with standard Watson–Crick pairs have pyrimidines 5′ of both ends of the loop. Thus, pyrimidine residues appear to be favored, but not required, on the 5′ edges of the 3RRs motif. The loop, 5′AAAG/3′CAGG, in the ribosomal 50S subunit is very sequence similar to the R2 loop, except that the AC pair is at the opposite end. The AG and GG pairs both form H/S pairs as expected, but the AA pair apparently forms a parallel H/H pair instead of an anti-parallel S/H pair, resulting in no cross-strand stacks (Harms et al. 2008). The AC pair does not form a WC/WC pair.
The C7A15 pair in the R2 internal loop has AN1-C amino hydrogen bonding (Fig. 4B), which is unusual in that a cis Watson–Crick/Watson–Crick CA pair often has A amino to CN3 and protonated AN1 to C carbonyl hydrogen bonds (Butcher et al. 1999; Cheong et al. 1999; Nissen et al. 1999; Wild et al. 1999; Ban et al. 2000; Carter et al. 2000). A single A amino to CN3 hydrogen bond is also commonly observed in X-ray structures. While the AN1–C amino pair has been reported in NMR models (Butcher et al. 1999; Cheong et al. 1999), to our knowledge the critical NOE between the C amino and AH2 has not been reported previously. Other common hydrogen-bonding arrangements, such as A amino to CN3, require a C amino to AH2 distance that is greater than indicated by the large NOE.
The structure of an entire 5′AGC/3′GGA triplet depends on adjacent pairs and surroundings. For example, in the crystal structure of isolated (Deng et al. 2003) or protein-bound (Batey et al. 2000, 2001) SRP RNA, the 5′AGC/3′GGA triplet in the internal loop, 5′AAGCAG/3′UGGACU, has cis WC/WC imino AG, single hydrogen bond (amino to carbonyl) S/H GG, and trans WC/H CA pairs. As isolated RNA in solution, the NMR structure of the 5′AGC/3′GGA triplet retains the imino AG pair, but the CA “pair” is not hydrogen bonded (Schmitz et al. 1999a,b). The GG “pair” has a sheared-like orientation of the G's as in the NMR structure of the R2 internal loop, although the orientation is reversed and was thought not to contain base–base hydrogen bonds (Schmitz et al. 1999b). Thus, the structure of the 5′AGC/3′GGA triplet in 5′AAGCAG/3′UGGACU differs from that reported here in the context of 5′GAAGCC/3′CAGGAG (tHS AG, tHS GG, cWW CA). This difference is presumably driven by the necessity of the AG pair to be imino in the 5′AAGCAG/3′UGGACU context to allow formation of the adjacent Watson–Crick AU pair (Gautheret et al. 1994). These structural comparisons provide interesting benchmarks for programs predicting 3D structures. For the 5′AAGCAG/3′UGGACU internal loop, the observed suite of base pairs is the third most probable generated by MC-FOLD, but becomes the most favorable after AMBER energy minimization (data not shown).
Either G16 or G17 is conserved in the related internal loops found in four other species of silk moths (Kierzek et al. 2009), and in each case there is the possibility of forming a GA pair (Fig. 1). Moreover, the sequence of the adjacent helix on the right is more conserved than the loop (Fig. 1). It is possible that the sequence or structure of the loop and adjacent helix is important for protein binding. It would not be surprising, however, if the structure of the entire loop could be changed by protein binding. For example, the loop, 5′CUAAG/3′GAAGC, has adjacent sheared AA and GA pairs in a solution NMR structure (Shankar et al. 2006), but in ribosomes (Harms et al. 2001; Schuwirth et al. 2005) the A initially paired with the U is completely bulged out of the helix. Interestingly, the 5′AAGC/3′AGGA loop studied here has the potential to bulge out an A and a C from the internal loop while forming three tandem GA pairs. The structures generated by MC-SYM suggest other possible alternative folds for this sequence.
MC-SYM can generate possible 3D structures for any short RNA sequence (Parisien and Major 2008). For the duplex studied here 10,000 structures were generated, and the resulting internal loops clustered into 88 different types of base-pairing suites. On the basis of sequence alone, current knowledge of RNA energetics was not sufficient to identify the base-pairing suite determined by NMR (Table 2). Adding only 22 easily obtained NMR restraints, however, allowed MC-SYM to identify the experimentally deduced base-pairing. No MC-SYM structure satisfied all of the NMR restraints, however. Evidently, detailed prediction of RNA 3D structure will require expansion of the database of known structures and of knowledge of the interactions determining structure.
The structure shown in Figure 4A is 1.6 kcal/mol more stable at 37°C than predicted by the current thermodynamic model (Mathews et al. 2004). This corresponds to a 13-fold enhanced equilibrium constant for folding. There are eight or nine potential hydrogen bonds (acceptor–donor distance less than ∼2.3 Å) within the four pairs that are not accounted for in the thermodynamic model. These presumably increase the stability of the loop. The 5′GAAGCC/3′CAGGAG R2 loop, however, is not as stable as internal loops of three consecutive GA pairs closed by one CG pair and either a UA or UG pair. The latter free-energy increments range from −2.0 to −2.6 kcal/mol at 37°C (Chen et al. 2006) in contrast to +0.6 kcal/mol for the R2 loop. Comparison of the R2 structure with the structures of three consecutive GA pairs suggests a net loss of two hydrogen bonds in the R2 internal loop.
Evidently, current understanding of interactions in RNA is not sufficient to predict either thermodynamic stability or structure for small, isolated internal loops in solution. Thus, the results presented here provide a useful benchmark for testing progress in understanding RNA interactions. Better understanding of the interactions in RNA would not only allow better predictions of the most stable structures for isolated loops, but also provide insight into structures close enough in free energy to be induced by binding of proteins or other changes in environment.
CONCLUSION
The 5′GAAGCC/3′CAGGAG R2 loop is unusually stable. With the terminal CA pair forming an approximately Watson–Crick pair, the structure can be described as a 3 × 3 nucleotide loop. While the sequence of the B. mori R2 internal loop is not found in previously known three-dimensional structures of RNA, the structure of the three purine–purine sheared pairs is similar to that found in other RNAs. Evidently, a 3RRs motif is a general building block for RNA structures, and thus far includes the following pairings: 5′GAA/3′AGG, 5′GAG/3′AGG, 5′GAA/3′AAG, and 5′AAG/3′AGG.
MATERIALS AND METHODS
Sequence design
The first base pairs closing the internal loop were made the same as found in the natural sequence (Fig. 1) because base-pair identity and orientation can affect the structure of a loop (Chen et al. 2007; Hammond et al. 2010). Additional base pairs and 3′ dangling end nucleotides were chosen to provide melting temperatures near 37°C with approximately equal stabilities for the two helical regions to favor two-state melting (Schroeder and Turner 2009). These additional nucleotides were also chosen to favor relatively simple NMR spectra. For example, there is only one AU pair, and all of the nearest neighbor base-pair combinations are different. No 5′ A was included, so that the number of proton resonances was minimized.
Oligonucleotide synthesis and purification
Oligonucleotides were synthesized on an Applied Biosystems 392 DNA/RNA synthesizer, using RNA phosphoramidite chemistry (Usman et al. 1987; Wincott et al. 1995). The phosphoramidites and CPG support were bought from Glen Research or Proligo. For each 1-μmol synthesis, the base-protecting groups and CPG support were removed by incubating in 2 mL of 3:1 (v/v) ammonia/ethanol solution at 55°C overnight (Stawinski et al. 1988). The solid support was removed by filtration and the filtrate was lyophilized. Removal of the silyl-protecting groups on the 2′-hydroxyls was achieved by incubation in a 9:1 (v/v) TEA-3HF (triethylamine trihydrofluoride)/DMF mixture at 55°C for 2 h or at room temperature for 24 h, followed by 1-butanol precipitation (Pirrung et al. 1994). The sample was lyophilized before redissolving in 5 mM ammonium bicarbonate (pH 7). The solution was loaded onto a Waters Sep-Pak C18 chromatography column to remove excess salts. The oligonucleotides were purified by TLC using a preparative Baker Si500F silica gel plate (20 × 20 cm, 500-μm thick) and 55:35:10 (v/v/v) 2-propanol/ammonia/water running solution. The products were identified by UV shadowing, and the slowest-running band on the plate was scraped off. RNA was extracted from silica with RNase free water and the Sep-Pak procedure was repeated to desalt the sample. Oligonucleotide purities were checked by analytical TLC Baker Si500F silica gel plate (500-μm thick) and polyacrylamide gel electrophoresis. All samples were >95% pure.
UV melting experiments and thermodynamics
Extinction coefficients for each single-stranded RNA were predicted from the oligonucleotide sequence using a nearest neighbor
model (Borer 1975; Richards 1975), and sample concentrations were calculated from the absorbance at 260 nm at 80°C. Oligonucleotides were lyophilized and
dissolved in 1.0 M NaCl, 20 mM sodium cacodylate, and 0.5 mM disodium EDTA (pH 6.5 and pH 5). Absorbance versus temperature
melting curves for the duplex were acquired at 260 nm with a heating rate of 1°C/min with a Beckman Coulter DU640C spectrophotometer
with a Peltier temperature controller cooled with flowing water. Melting curves were fit to a two-state model with the Meltwin
program, assuming linear sloping baselines and temperature-independent ΔH° and ΔS° (McDowell and Turner 1996). The melting temperatures, TM (in kelvin), at different concentrations were used to calculate the thermodynamic parameters according to Borer et al. (1974): where R is the gas constant (1.987 cal/mol·K). The equation ΔG°37 = ΔH°–310.15ΔS° was used to calculate the free energy change at 37°C. Thermodynamic parameters were also obtained from averaging
the fits of individual melting curves.
where R is the gas constant (1.987 cal/mol·K). The equation ΔG°37 = ΔH°–310.15ΔS° was used to calculate the free energy change at 37°C. Thermodynamic parameters were also obtained from averaging
the fits of individual melting curves.
NMR sample preparation
The two strands were mixed in 300 μL of RNase free water and dialyzed for 12 h against 1 L of filtered autoclaved water in a Gibco Life Technologies microdialysis system with a 1000 molecular weight cutoff Spectro-por dialysis membrane. After dialysis, the sample was lyophilized and dissolved in 280 μL of buffer (80 mM NaCl, 10 mM sodium phosphate, 0.5 mM Na2EDTA at pH 6.5). A slightly acidic pH was used to decrease line broadening of exchangeable protons (Fritzsche et al. 1981). The sample was dried and reconstituted with 90:10 (v/v) H2O/D2O for experiments involving exchangeable protons, or with 100% D2O for spectroscopy of nonexchangeable protons. The total duplex concentration was ∼1.7 mM. The sample was placed in a Shigemi tube for collection of spectra.
NMR spectroscopy
Spectra were collected with Varian Inova 500 and 600 MHz spectrometers. One-dimensional imino proton spectra of samples in 90:10 (v/v) H2O:D2O were acquired with an S pulse sequence for water signal suppression (Smallcombe 1993; Lukavsky and Puglisi 2001) and a sweep width of 12 kHz at temperatures ranging from 0°C to 45°C. Assignment of exchangeable imino and amino protons was accomplished with two-dimensional SNOESY spectra recorded with mixing times of 100 and 200 msec at temperatures of 0°C, 5°C, and 15°C using a spectral width of 15,000 Hz in the direct dimension and either 12,000 Hz (no wrapped peaks) or 8176 Hz (imino peaks wrapped) in the indirect dimension. A natural-abundance 1H-15N heteronuclear single-quantum coherence (HSQC) spectrum was acquired to confirm assignments of G and U imino protons.
One-dimensional spectra of the sample in 100% D2O were acquired at temperatures ranging from 0°C to 70°C. Assignment of nonexchangeable protons was accomplished with two-dimensional NOESY (mixing times of 100, 200, and 400 msec), DQF-COSY, TOCSY (mixing times of 13 and 80 msec), 1H-13C HSQC, and 1H-31P heteronuclear correlation (HETCOR) spectra acquired at 20°C with additional NOESY spectra acquired at 0°C. DQF-COSY, TOCSY, and 1H-13C HSQC spectra were all wrapped in the indirect dimension to maximize resolution.
NMRpipe software was used to process 2D spectra (Delaglio et al. 1995) and Sparky was used to assign resonances and analyze NOE cross-peak volumes (Goddard and Kneller 2004). Proton chemical shifts are reported relative to DMS by referencing to H2O or HDO (Supplemental Table S1).
Generating restraints
Internuclear distance restraints were derived from NOE (mixing time of 100 msec) cross-peak volumes using (1/r)6 scaling referenced to H5–H6 (2.45 Å) and H1′–H2′ (2.75 Å) peak volumes in the Watson–Crick stems. Lower and upper distance limits for nonexchangeable protons were set, allowing for a fourfold error in determination of cross-peak volumes. Restraint limits for exchangeable protons were set wider (±40% of the 1/r6 distance determined by peak volume for slowly exchanging protons and only loose upper-limit restraints for rapidly exchanging protons). Three restraints for which no NOE was observed (3–5 Å lower limit and upper limit 10–15 Å for missing or very weak cross-peaks) were applied to enhance convergence in initial modeling, but were removed in the final modeling. Modeling without these restraints produced an average structure with an RMSD of 0.1 Å relative to the average structure reported here. Watson–Crick hydrogen-bond restraints as indicated by imino proton cross-peaks in NOESY spectra were applied between bases that were not a part of the internal loop. Dihedral angle restraints were determined based on sugar proton and phosphorus scalar couplings taken from TOCSY, DQ-COSY, NOESY, and 1H-31P HETCOR spectra (Varani et al. 1996). Strong H3′–H4′ peaks and the absence of H1′–H2′ peaks in the TOCSY spectra indicated a C3′-endo sugar pucker (δ ∼81°). H4′–H5′/H5″ J-couplings <2 Hz indicated that γ was not in the trans or g- conformation, and so the γ dihedral angle was restrained to g+ (γ ∼60°). In cases where J (H4′–H5′/H5″) was >7 Hz, γ was restrained to be trans (γ ∼180°). 31P(n+1)-H3′ (n) J-couplings >7 Hz indicated ɛ ∼ −115° (excluding g+). Weak 31P-H5′/H5″ cross-peaks in 1H-31P HETCOR spectra (J-coupling <3 Hz) indicated β in the trans conformation (∼165°). Measureable couplings in the stem residues were within typical A-form ranges. Consequently, backbone dihedrals in the stem were loosely restrained to A-form values: α (−65 ± 90°), β (165 ± 75°), γ (60 ± 60°), ɛ (−115 ± 125°), ζ (−70 ± 90°) as defined previously (Richardson et al. 2008). In loop residues, all angles were restrained to A-form values, except between G16 ɛ and A18 α.
Structure determination
Simulated annealing was carried out with distance and dihedral angle restraints generated from NMR data. Initial structures were obtained with the program CNS version 1.2 (Brunger et al. 1998) with the following protocol: (1) high-temperature dynamics at 5000 K in torsion angle space for 4 psec with NOE and dihedral scale factors of 150 kcal/mol Å2 and 25 kcal/mol rad2, respectively; (2) simulated annealing in torsion angle space for 40 psec with slow cooling from 2000 to 0 K (40,000 steps) with NOE and dihedral scale factors of 75 kcal/mol Å2 and 100 kcal/mol rad2, respectively; (3) simulated annealing for 40 psec in Cartesian space with slow cooling from 1000 to 0 K (40,000 steps) with the NOE and dihedral angle scale factors constant at 75 kcal/mol Å2 and 100 kcal/mol rad2, respectively; the van der Waals factor was linearly increased from 1 to 4; and (4) Powell energy minimization was applied with full van der Waals and electrostatic terms. A total of 40 structures were calculated from randomized initial atom velocities applied to approximately A-form initial coordinates. These structures were subjected to an additional 100 psec of simulated annealing and restrained molecular dynamics using the program AMBER (version 10, ff99 force field, generalized-Born implicit solvent) (Case et al. 2008). In this annealing, the models were heated to only 600 K for 5 psec with tight temperature coupling, followed by gradual cooling to 0 K over the next 95 psec. Distance and dihedral restraints used in the CNS calculation were also used in the AMBER calculation with scale factors of 30 kcal/mol Å2 and 20 kcal/mol rad2, respectively. Structures with distance or dihedral angle restraints exceeding 0.2 Å or 5°, respectively, were eliminated. Of the remaining structures, the 10 with the lowest constraint energy were selected for further analysis, and the ensemble of atomic coordinates are deposited in the Protein Data Bank with ID 2L8F. Structure analysis and figures were generated with Pymol (DeLano 2002; http://pymol.org).
Structure prediction and annotation
The MC-Sym computer program was used to generate a decoy of 10,000 3D models of the RNA duplex (Parisien and Major 2008). The four noncanonical base pairs in the duplex are spanned by three consecutive 2 x 2 nucleotide cyclic motifs (NCMs) (i.e., tandems of base pairs). MC-Sym systematically assigned and merged the three NCMs corresponding to the sequence of the RNA duplex. The NCMs were taken from structures available in the Protein Data Bank (PDB) (Berman et al. 2000), as well as from a library of computationally built NCMs. The latter resulted from substituting and aligning the C1′, N1, or N9, and C2 or C4 atoms of base templates with that of all 2 x 2 NCMs found in the PDB. The RNA duplex models were submitted to a steepest descent minimization using AMBER as implemented in the Tinker molecular modeling package version 5.0 (Ren and Ponder 2003), until a gradient RMS of 5.0 kcal/mol/Å. Na+ atoms were placed geometrically at each backbone O = P-O– group before minimization to counteract the negatively charged RNA backbone. During minimization, all nucleobase atoms were forced to stay at their initial location using a spring constant of 1001 kcal/mol/Å2. Then, the models were submitted to the “anneal” mode of Tinker for unconstrained simulated annealing via molecular dynamics from 100 to 0 K for a total of 10 psec. The GB/SA model (Hasel et al. 1988) was turned on to take into account the contribution of the solvent. The RNAview program (Yang et al. 2003) was used for base-pairing type annotation and MC-Annotate (Gendron et al. 2001) was used for base stacking.
SUPPLEMENTAL MATERIAL
Supplemental material (chemical shifts, NOE-derived distance restraints, and the MC-Sym input script) is available for this article.
ACKNOWLEDGMENTS
We thank Walter Moss for creating Figure 1. This work was supported by NIH Grant GM22939 (to D.H.T.).
Footnotes
-
↵4 Corresponding author.
E-mail turner{at}chem.rochester.edu.
-
Article published online ahead of print. Article and publication date are at http://www.rnajournal.org/cgi/doi/10.1261/rna.2641911.
- Received January 24, 2011.
- Accepted May 8, 2011.
- Copyright © 2011 RNA Society




