


Fluorescent labeling of tRNA dihydrouridine residues: Mechanism and distribution
- 1Department of Chemistry, University of Pennsylvania, Philadelphia, Pennsylvania 19104-6323, USA
- 2Anima Cell Metrology, Inc., Bernardsville, New Jersey 07924-2270, USA
Abstract
Dihydrouridine (DHU) positions within tRNAs have long been used as sites to covalently attach fluorophores, by virtue of their unique chemical reactivity toward reduction by NaBH4, their abundance within prokaryotic and eukaryotic tRNAs, and the biochemical functionality of the labeled tRNAs so produced. Interpretation of experiments employing labeled tRNAs can depend on knowing the distribution of dye among the DHU positions present in a labeled tRNA. Here we combine matrix-assisted laser desorption/ionization mass spectroscopy (MALDI-MS) analysis of oligonucleotide fragments and thin layer chromatography to resolve and quantify sites of DHU labeling by the fluorophores Cy3, Cy5, and proflavin in Escherichia coli tRNAPhe and E. coli tRNAArg. The MALDI-MS results led us to re-examine the precise chemistry of the reactions that result in fluorophore introduction into tRNA. We demonstrate that, in contrast to an earlier suggestion that has long been unchallenged in the literature, such introduction proceeds via a substitution reaction on tetrahydrouridine, the product of NaBH4 reduction of DHU, resulting in formation of substituted tetrahydrocytidines within tRNA.
Keywords
INTRODUCTION
Fluorescent-labeled tRNAs have been used extensively in mechanistic studies of in vitro protein synthesis, and, more recently, to monitor protein synthesis within intact cells (S Barhoom, J Kaur, BS Cooperman, NI Smorodinsky, Z Smilansky, M Ehrlich, and O Elroy-Stein, in prep.). For such studies, fluorescent groups have been introduced in a variety of ways, either by derivatization of the amino acid with which the tRNA is charged (McIntosh et al. 2000, Woolhead et al. 2004) or via covalent attachment of fluorophores to modified nucleosides having unique chemical reactivity (Schleich et al. 1978; Blanchard et al. 2004a,b; Bieling et al. 2006; Munro et al. 2007; Fei et al. 2008; Pan et al. 2009; Bharill et al. 2011; Chen et al. 2011). Of the latter, dihydrouridine (DHU) is by far the most abundant, occurring in >90% of both prokaryotic and eukaryotic tRNAs, at stoichiometries of 1–6 DHU/tRNA, with most being found within the D-loops of tRNAs. Moreover, introduction of NH2-containing fluorophore nucleophiles into DHU positions via NaBH4 reduction results in labeled tRNAs retaining substantial activity in protein synthesis (Pape et al. 1998; Savelsbergh et al. 2003; Betteridge et al. 2007; Grigoriadou et al. 2007a,b; Pan et al. 2007).
Earlier studies made extensive use of proflavin derivatives of tRNA. More recently we reported (Pan et al. 2009) a procedure employing hydrazides to introduce Cy3 and Cy5 dyes, suitable for both ensemble and single molecule FRET (smFRET) studies, into DHU positions of tRNA. Knowing the distribution of dye among the DHU positions present in a labeled tRNA can be important for interpretation of FRET results, as FRET efficiency values are dependent on the distance between the two fluorophores. In addition, dye labeling of tRNA can affect its functional activity, and such functional effects can be position dependent. Wintermeyer and Zachau (1979) utilized a combination of ion-exchange chromatography, disk-gel electrophoresis, and thin layer chromatography of radioactively labeled oligonucleotide fragments generated by the endonuclease digestion to determine the distribution of ethidium and proflavin dyes between the 16 and 17 DHU positions in yeast tRNAPhe. Here we carry out similar but more facile analyses of Cy3, Cy5, and proflavin derivatives of Escherichia coli tRNAArg and E. coli tRNAPhe, each of which has two DHU/tRNA, at positions 17 and 20a, and 16 and 20, respectively (see Supplemental Material), by combining MALDI-MS analysis of endonuclease-generated oligonucleotide fragments (Polo and Limbach 1998, Kirpekar et al. 2000, Berhane and Limbach 2003a,b, Hartmer et al. 2003, Meng and Limbach 2004, Zhao and Yu 2004, Hossain and Limbach 2007, Hengesbach et al. 2008, Hossain and Limbach 2009) and thin layer chromatography.
Despite the extensive use of fluorescent tRNAs labeled at DHU positions, the precise chemistry of the reaction leading to fluorophore introduction into these positions has been unclear. As part of this work reported below we have carried out model chemistry, which, combined with the MALDI-MS analysis of labeled tRNAs, demonstrates that such introduction via NaBH4 reduction results in a substitution reaction on tetrahydrouridine by reagents having the general structure RNH2, resulting in formation of a substituted tetrahydrocytidine.
RESULTS AND DISCUSSION
Dihydrouridine (DHU) reduction and benzohydrazide substitution
A clear understanding of the chemistry of DHU reduction and subsequent reaction with RNH2-containing compounds is important for the work reported below on characterizing fluorescent-labeled tRNAs. Earlier studies of NaBH4 reduction of DHU reported two different products for reactions carried out under different conditions. The principal product formed using a 1:1 NaBH4:DHU stoichiometry for 35 min at 0°C is tetrahydrouridine (THU) (Hanze 1967), a well known inhibitor of cytidine deaminase (Wentworth and Wolfenden 1975) that is used in combination cancer chemotherapy (Li et al. 2009), whereas more forcing conditions (2:1 stoichiometry, 2 h, room temperature) afforded the doubly reduced, ring-opened product N-(β-D-ribofuranosy1)-N-(γ-hydroxypropy1)urea (Cerutti et al. 1968). In the work reported here, we carried out DHU reduction using conditions typically used in tRNA labeling experiments (a large molar excess of NaBH4, 1 h incubation, 0°C (Wintermeyer and Zachau 1979; Pan et al. 2009). A single product formed in high yield was seen by TLC analysis that corresponded to THU, as characterized by NMR and IR spectra, with no evidence of N-(β-D-ribofuranosy1)-N-(γ-hydroxypropy1)urea formation (see Materials and Methods). THU reaction with benzohydrazide, carried out in a water:methanol (0.2:5.0) mixed solvent that was acidified with acetic acid (4 h, 40°C) led to conversion of THU to N4-benzoamido-tetrahydrocytidine (1) (Fig. 1), as characterized by NMR and IR spectra. Overall formation of 1 from DHU is summarized in Figure 1. Under the mild acid conditions that are required for step 2, substitution of the hydrazide for the hydroxy group may proceed via reversible general-acid catalyzed formation of dehydrated THU, followed by a nucleophilic attack on the resulting Schiff base, as indicated. To our knowledge, this is the first report of a nucleophilic substitution reaction on THU.
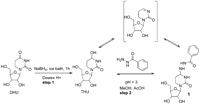
Synthetic scheme for N4-benzoamido-tetrahydrocytidine (1) preparation. The bracketed structure is a plausible intermediate in step 2.
Cy3, Cy5, and proflavin labeling of E. coli tRNAArg and E. coli tRNAPhe
Dye labeling of tRNAs was carried out essentially as described (Pan et al. 2009), using either Cy3 hydrazide, Cy5 hydrazide, or proflavin.
MALDI analyses of endonuclease digests of labeled tRNAs
Optimization of digestion conditions
We used E. coli tRNAArg to identify RNase T1 and RNase A digestion conditions leading to the generation of virtually the full complement of expected oligonucleotides containing ≥2 nucleotides, as identified by MALDI analysis (Table 1). Starting with conditions described by Hossain and Limbach (2007), we found that shorter incubation times, important for retention of fluorescent label, were sufficient for complete digestion (10 min vs. 1–2 h, 1 U RNase A/μg tRNA or 50U RNase T1/μg tRNA) of unmodified tRNA for both enzymes and generated all products as the 3′-linear phosphates. However, increased RNase A (5 U RNase A/μg tRNA) was required for RNase A cleavage at positions of DHU derivatized with either Cy3 or Cy5. RNase A catalyzes RNA hydrolysis via 2′,3′-cyclic phosphate formation and hydrolysis. The higher RNase A level led to the detection of Cy3/Cy5-labeled fragments from modified E. coli tRNAPhe as 3′-linear phosphates, although labeled fragments from modified E. coli tRNAArg were only detected as 2′,3′-cyclic phosphates (Table 2). Our results indicate that the hydrolysis step is particularly sensitive to inhibition by DHU derivatization and that, given the differences observed in the digestions of labeled tRNAPhe and tRNAArg, the strength of such inhibition is likely to be sequence dependent.
MALDI peaks from RNase digested unlabeled tRNA
MALDI determinations of dye-labeled oligonucleotides derived from dye-labeled tRNAs
MALDI analysis of the RNase digestion products of unlabeled tRNAArg
MALDI analyses of RNase T1 and RNase A digestions of unlabeled tRNAArg show major and minor peaks (Fig. 2) corresponding to expected fragments on RNase T1 digestion (Table 1), including the DHU containing nucleotides, AD20aAG (m/z 1330.2) (Fig. 2A) and CD17G (m/z 977.2) (Fig. 2B). RNase A digestion shows a minor peak at m/z 1346.2 for the GGAD fragment. High background prevented the assignment of a peak to the expected mononucleotide D17.
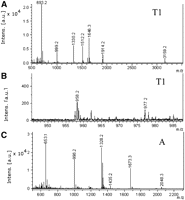
MALDI analyses of RNase digests of tRNAArg. (A) T1 digest, major peaks; (B) detail of 860–1000 m/z region of T1 digest, showing presence of minor peak at 977.2 m/z, corresponding to CD17G 3′P; (C) A digest, major peaks.
MALDI and MALDI-TOF-TOF analysis of RNase T1 digestion products of reduced and dye-labeled tRNAArg
NaBH4-reduced tRNAArg
With respect to the major peaks seen in Figure 2A, NaBH4 reduction leads to selective disappearance of only the 1330.2 peak, corresponding to AD20aAG. Examination of the 1330 region (Fig. 3) shows that the disappearance of the 1330.2 peak is accompanied by the appearance of two new peaks at 1314.2 and 1316.2, and an apparent increase in the relative intensity of the peak at m/z 1332.2. As the 1332.2 peak in the unreduced sample is an isotopic peak of the major peak at 1330.2, the increase in its relative intensity on NaBH4 reduction is consistent with the formation of a THU at position 20a, and the 1314.2 peak is consistent with the dehydration of THU to form the dihydropyrimidin-2-one, prior to and/or during mass spectral analysis. Dehydration of THU in the mass spectrometer, presumably to give the dihydropyrimidin-2-one, has previously been described by Hanze (1967). Although we are unable to assign a structure to the new peak at 1316.2 with confidence, one possibility is that it corresponds to reduction of the dihydropyrimidin-2-one to form the tetrahydropyrimidin-2-one. Consistent with the model DHU reduction chemistry reported above, no new peak is seen at m/z 1334.2, which would have corresponded to the formation of N-(β-D-ribofuranosy1)-N-(γ-hydroxypropy1)urea at position 20a.
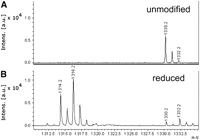
MALDI analyses of RNase T1 digests of unmodified tRNAArg and NaBH4-reduced tRNAArg. (A) Unmodified tRNAArg, showing detail of 1310–1335 m/z region and 1330 peak corresponding to unmodified AD20aAG 3′P; (B) same as A, but for NaBH4-reduced tRNAArg.
Cy3- and Cy5-labeled tRNAArg
With respect to unlabeled tRNAArg, MALDI analysis of Cy3- and Cy5-labeled tRNAArg leads to the appearance of two new major peaks at m/z 1958.5 and m/z 1984.5, respectively (Fig. 4A,B), and two new minor peaks at m/z 1605.5 and m/z 1631.5, respectively (Fig. 4C,D). MALDI-TOF-TOF analyses of these four new peaks (Fig. 4E–H) show that each decomposes to give two new peaks, one corresponding to the parent nucleotide containing dehydrated THU in place of DHU (E, F: AD20aAG, m/z 1314.2; G, H: CD17G, m/z 961.2) and one corresponding either to Cy3-hydrazide (m/z 645.3) (Fig. 4E,G) or Cy5-hydrazide (m/z 671.3) (Fig. 4F,H). These mass spectral analyses, when coupled with the DHU reduction results presented previously, support the mechanism for dye labeling of tRNA that parallels Figure 1, in which the incoming hydrazide displaces the 4-hydroxyl group of THU, giving rise to a substituted tetrahydrocytidine (THC).
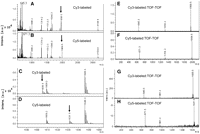
MALDI and TOF-TOF analyses of RNase T1 digests of reduced and labeled tRNAArg. (A–D): MALDI analyses—arrows indicated new peaks observed on digestion of labeled tRNAArg. (A) Major peaks, Cy3-labeled tRNAArg; (B) major peaks, Cy5-labeled tRNAArg; (C) detail of 1600–1660 m/z region, Cy3-labeled tRNAArg; (D) detail of 1600–1660 m/z region, Cy5-labeled tRNAArg. (E–H): TOF-TOF analyses: (E) 1958.5 m/z peak in A; (F) 1984.5 m/z peak in B; (G) 1605.5 m/z peak in C; (H) 1631.5 m/z peak in D.
MALDI analyses of other RNase digestion products
MALDI and MALDI-TOF-TOF analyses similar to those described earlier were also carried out on RNase A digests of unlabeled and Cy3- and Cy5-labeled tRNAArg and of RNase T1 and RNase A digests of Cy3- and proflavin-labeled tRNAPhe. In each case, the only dye-labeled peaks are derived from oligonucleotides that in underivatized tRNA include a DHU residue, have masses corresponding to a substituted tetrahydrocytidine product as depicted in Figure 1 (with the fluorophore RNH2 replacing benzohydrazide), and decompose on MALDI-TOF-TOF analysis to the dehydrated THU and the dye. These results are summarized in Table 2, where the constant 16 amu difference in mass between the unmodified oligonucleotide and the dehydrated THU seen by MALDI-TOF-TOF is due to a gain of 2 amu on reduction of DHU to THU, followed by a loss of 18 amu on dehydration. Interestingly, replacement of DHU by a substituted THC does not prevent RNase A cleavage, as seen both by the appearance of peaks corresponding to the labeled oligonucleotides (Table 2) and the failure to detect larger oligonucleotides that would have resulted from blockage of such cleavage by substituted THC formation. Such replacement, which minimally perturbs the core tRNA structure, may account for the relatively high activity of the dye-modified tRNAs in protein synthesis assays (Pan et al. 2009).
Formation of substituted tetrahydrocytidines
The demonstration in this work that RNH2 labeling of NaBH4-reduced tRNA leads to replacement of DHU residues with substituted THCs contrasts markedly with the earlier suggestion by Wintermeyer and Zachau (1971, 1974), invoked as well by Betteridge et al. (2007) and Pan et al. (2009), that such labeling proceeds via RNH2 displacement of a putative 3-ureidopropanol product of DHU reduction. As we have seen, the reduction reaction conditions employed both here and in the later work of Wintermeyer and Zachau (1979) lead to THU rather than N-(β-D-ribofuranosy1)-N-(γ-hydroxypropy1)urea formation. Moreover, even under more forcing reduction conditions leading to 3-ureidopropanol formation, it is not clear that RNH2 would readily displace the ureido group under the conditions employed in the earlier work of Wintermeyer and Zachau (pH 3, 45 min, 37°C). Thus, acid hydrolysis of the ureidopropanol link to the ribose proceeds to only 90% completion under much more vigorous conditions (0.5 N H2SO4, 4 h, 65°C) (Cerutti and Miller 1967).
Dye distributions between dihydroU positions in Cy3-labeled tRNAs
The dye-labeled oligonucleotides produced by RNase A digestion of Cy3-labeled tRNAArg and tRNAPhe samples could be separated from each other by TLC (Fig. 5). Following elution, each band was identified as a substituted THC oligonucleotide by mass spectral analysis. Thus, as demonstrated by mass spectral analysis, bands 1 and 2 in Figure 5A correspond to the derivatized D17 and GGAD20a, respectively (Fig. 5B), whereas bands 1 and 2 in Figure 5C correspond to the THC adducts of AGD16 and GGD20, respectively (Fig. 5D). UV spectral analysis of the eluate from each band afforded precise quantification of the amount of dye contained therein, leading to the values shown in Table 3. We conclude that the intrinsic reactivities toward dye labeling of NaBH4-reduced DHUs 17 and 20a in E. coli tRNAArg are approximately equal, as are the intrinsic reactivities of NaBH4-reduced DHUs 16 and 20 in E. coli tRNAPhe.
Cy3-labeling stoichiometries of tRNAs used for MALDI analysis
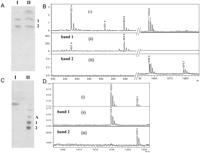
Quantification and identification of Cy3-labeled RNase A oligonucleotides. (A) TLC analysis of digest of Cy3-labeled tRNAArg. Lane I, digest; lane II, digest plus added Cy3-hydrazide. (B) MALDI spectra—(i) Cy3-labeled tRNAArg digest, showing Cy3-D17 peak at m/z 937.4 (Na+ adduct at 959.4) and Cy3-GGAD20a peak at m/z 1956.6, respectively; (ii) and (iii); parallel spectra for bands 1 and 2 (A), respectively. The peak at m/z 1978.7 corresponds to the Na+ adduct of Cy3-GGAD20a. (C) TLC analysis of digest of Cy3-labeled tRNAPhe. Lane I, Cy3-hydrazide; lane II, digest. (D) MALDI spectra—(i): Cy3-labeled tRNAPhe digest, showing Cy3-AGD16 peak at m/z 1629.5 and Cy3-GGD20 peak at m/z 1645.5, respectively; (ii) and (iii); parallel spectra for bands 1 and 2 (C), respectively.
Our results parallel earlier findings (Wintermeyer and Zachau 1979) that DHUs 16 and 17 in yeast tRNAPhe also have similar intrinsic reactivities toward dye labeling. Taken together, both sets of results suggest that the intrinsic reactivities toward dye labeling of NaBH4-reduced DHU residues in the D-loops of tRNAs, which are found at positions 16, 17, 20 and/or 20a, are generally similar. This suggestion can be relevant in interpreting the results of mechanistic studies employing fluorescent tRNAs labeled at DHU positions (e.g., utilizing smFRET [Chen et al. 2011] or ensemble FRET [Pan et al. 2009]). Such studies often utilize tRNA preparations containing ∼1 dye/tRNA. As most tRNAs contain more than one DHU/tRNA, such preparations will, in general be heterogeneous, with fluorescent label spread approximately evenly over the available DHU positions. Investigators utilizing such labeled tRNAs should be mindful of the possible effects such heterogeneity could have on measured functional activities and fluorescence properties. Resolution of at least some of the potential problems raised by such heterogeneity may be achievable via comparisons of results obtained using labeled tRNAs that have DHUs at different D-loop positions (e.g., tRNAPhe from E. coli and yeast, which have DHUs at positions 16/20 and 16/17, respectively).
SUMMARY
Here we demonstrate that, in contrast to an earlier suggestion in the literature, labeling of tRNAs by RNH2-containing dyes at NaBH4-reduced DHU positions proceeds via initial tetrahydrouridine formation, followed by a substitution reaction that yields a substituted tetrahydrocytidine. We also describe a method, based on mass spectral and TLC analyses, for identifying and quantifying sites of labeling by RNH2-containing dyes within NaBH4-reduced tRNAs that does not require the use of radioactive isotopes. Application of this method to dye-labeled derivatives of E. coli tRNAArg and tRNAPhe, both of which have two DHU residues, shows that, in each case, the two residues have very similar intrinsic reactivities toward labeling.
MATERIALS AND METHODS
E. coli tRNAArg and E. coli tRNAPhe were purchased from Chemical Block. Diammonium hydrogen citrate (DAHC), 2,4,6-trihydroxyacetophenone (THAP), uridine, NaBH4, proflavin, Dowex X 50 and benzohydrazide were purchased from Sigma-Aldrich. RNases T1 and A were used as obtained from Roche Molecular Biochemicals. Cy3-hydrazide, Cy5-hydrazide were from GE healthcare. Dihydrouridine was synthesized by reduction of uridine as described by Paryzek and Tabaczka (2001).
Synthesis of tetrahydrouridine (THU)
NaBH4 (10 equiv) was added to 1 g of DHU dissolved in 0.5 mL of water at 0°C, and incubation was continued for 1 h with stirring. The reaction was quenched by raising the pH to 4 via gradual addition of protonated Dowex X 50 at 0°C. Filtration followed by lyophilization afforded a white solid (85% yield), that gave a single spot on analytical TLC analysis (Silica gel, 50% MeOH/DCM, Rf = 0.4, p-anisaldehyde detection) identified as THU by IR and 1H NMR spectra: IR (KBr) Vmax cm−1: 3323, 2930, 1641, 1504, 1073, 755; 1H NMR (400 MHz, D2O) δ 1.75–1.77 (m, 1H, C5Ha), 1.96–2.03 (m, 1H, C5Hb), 3.21–3.36 (m, 2H,C6Hab), 3.54–3.67 (m, 2H, C5′ protons), (3.82–3.87 [m, 1H], 3.99–4.02 [m, 1H], 4.16–4.54 [m, 1H]: C2′, C3′, and C4′ protons), 4.54–4.57 (m, 1H, C4H), 5.74 (d, J = 7.9 Hz, 1H, C1′ proton).
Synthesis of N4-benzoamido-tetrahydrocytidine (1)
THU (0.25 g) was dissolved in 5.2 mL of MeOH:water (25:1) and acetic acid was added until an apparent pH of 3 was attained. Benzohydrazide (1.2 equiv.) was added and the reaction mixture was stirred at 40°C for 4 h. Following lyophilization, 1 was purified by preparative TLC (Silica gel, 30% MeOH/DCM, Rf 0.3) in 50% yield. IR (KBr) Vmax cm−1: 3323, 2925, 2501, 1636, 1504, 1073, 1037, 755; 1H NMR (500 MHz, D2O) δ 1.82–1.93 (m, 2H, C5 protons), 3.36–3.42 (m, 2H C6 protons), 3.61–3.72 (m, 2H, C5′ protons), (3.90–3.92 [m, 1H], 4.07 [dd, J = 9.5 Hz, J = 5.5 Hz, 1H], 4.20–4.25 [m, 1H]: C2′, C3′, and C4′ protons), 4.89–5.07 (m, 1H, C4H), 5.79 (d, J = 7.0 Hz, 1H, C1′ proton), (7.48–7.49 [m, 2H], 7.51–7.54 [m, 1H], 7.76–7.78 [m, 2H]: phenyl protons).
Cy3/Cy5 labeling of tRNA
tRNA (2.5 mg/mL) was incubated with NaBH4 (10 mg/mL, added from a 100 mg/mL stock solution in 10 mM KOH) in 40 mM Tris-HCl (pH 7.5) at 0°C for 60 min, in a total volume of 400 μL, followed by quenching with 6 N acetic acid (80 μL). Excess reagent was removed by three ethanol precipitations of reduced tRNA, denoted tRNA (red). Dried tRNA (red) (2 nmol) was dissolved in 1.5 μL of 0.1 M sodium formate (pH 3.7), 0.2 μL of Cy3-hydrazide (200 mM) in DMSO was added, and incubation was carried out for 150 min at 37°C. During this period, additional portions (0.1 μL) of the Cy3-hydrazide solution were added at 50 and 100 min. Following vacuum drying, the dried sample was dissolved in 400 μL of 50 mM sodium acetate at pH 6.5, and unbound dye was removed by three to four cycles of ethanol precipitation.
Proflavin labeling of tRNA
NaBH4 reduced tRNA (0.5 mg/50 μL) prepared as described previously was incubated with 1 mL of 0.1 M Na formate (pH 3.0) containing 0.52 mg/mL of proflavin (3,6-diaminoacridine) hemisulfate salt for 45 min at 37°C. Following incubation, the reaction mixture was brought to pH 7 with 2 M Tris-HCl (pH 8.5) (∼100 μL). Unbound proflavin was removed by three to four phenol extractions (Na acetate, pH 6.5), and traces of phenol were removed by one to two chloroform extractions and two cycles of ethanol precipitation.
RNase digestion of tRNAs
Digestions with both RNase T1 (50U/μg tRNA) and RNase A (5U/μg tRNA) were carried out in ammonium acetate buffer (220 mM, pH 6.5, 1.5 μL) for 10 min at 37°C. Addition of ammonium acetate inhibits formation of alkali salts (Nordhoff et al. 1996), obviating the need for a purification step prior to MS analysis.
Mass spectrometric analysis
Mass spectrometry experiments were performed on a Bruker Ultraflex MALDI-TOF from Bruker Daltonics having a 3-m effective flight path, a two-stage gridless ion reflector, pulsed ion extraction, and a nitrogen laser (337 nm). All MALDI spectra were acquired in positive polarity and in reflectron mode. Vendor-supplied Flex control and Flex analysis software were used for data acquisition and processing, respectively. Typically, 200 laser shots were co-added per spectrum. Each spectrum was smoothed using a five-point Savitsky–Golay algorithm and background subtracted. The instrument was calibrated externally with calibrant mixtures provided by Bruker that bracketed the m/z range of interest. LIFT mass spectra were acquired on a Bruker Ultraflex TOF/TOF mass spectrometer operated in the positive ion mode. Metastable fragmentation was induced by a nitrogen laser (337 nm) without the further use of collision gas. Precursor ions were accelerated to 8 kV and selected in a timed ion gate. In the LIFT-cell the fragments were further accelerated to 19 kV. The reflector potential was 29 kV.
The matrix components were 250 mM THAP in acetonitrile and 300 mM DAHC in water, with each being prepared fresh before use. Equal volumes of THAP and DAHC were combined and then mixed with an equal volume of the sample solution. Approximately 1 μL of this sample/matrix solution was spotted on the target MALDI plate. For the MALDI analysis of fragments <1000 amu where the background from the matrix is high, such as Cy3-D (molecular weight 937), samples were analyzed using target plates with a hydrophilic anchor (AnchorChip 600 μm, Bruker) and a 10-fold reduction in matrix components.
TLC of labeled oligonucleotides
Labeled fragments were resolved on a silica gel TLC plate (60 F-254) eluted with a freshly prepared solution of water: NH4OH: 1-propanol (1:3.5:5.5).
SUPPLEMENTAL MATERIAL
Supplemental material is available for this article.
ACKNOWLEDGMENTS
This work is supported by NIH grant nos. GM-071014 and GM-080376 and NIST grant no. 70NANB7H7011. We thank Dr. Rakesh Kohli for help in obtaining mass spectra and Professor Yale E. Goldman for valuable discussions. We also thank the developers of the MongoOligo web site.
Footnotes
-
↵4 Corresponding author.
E-mail cooprman{at}pobox.upenn.edu.
-
Article published online ahead of print. Article and publication date are at http://www.rnajournal.org/cgi/doi/10.1261/rna.2670811.
- Received February 11, 2011.
- Accepted April 27, 2011.
- Copyright © 2011 RNA Society




