


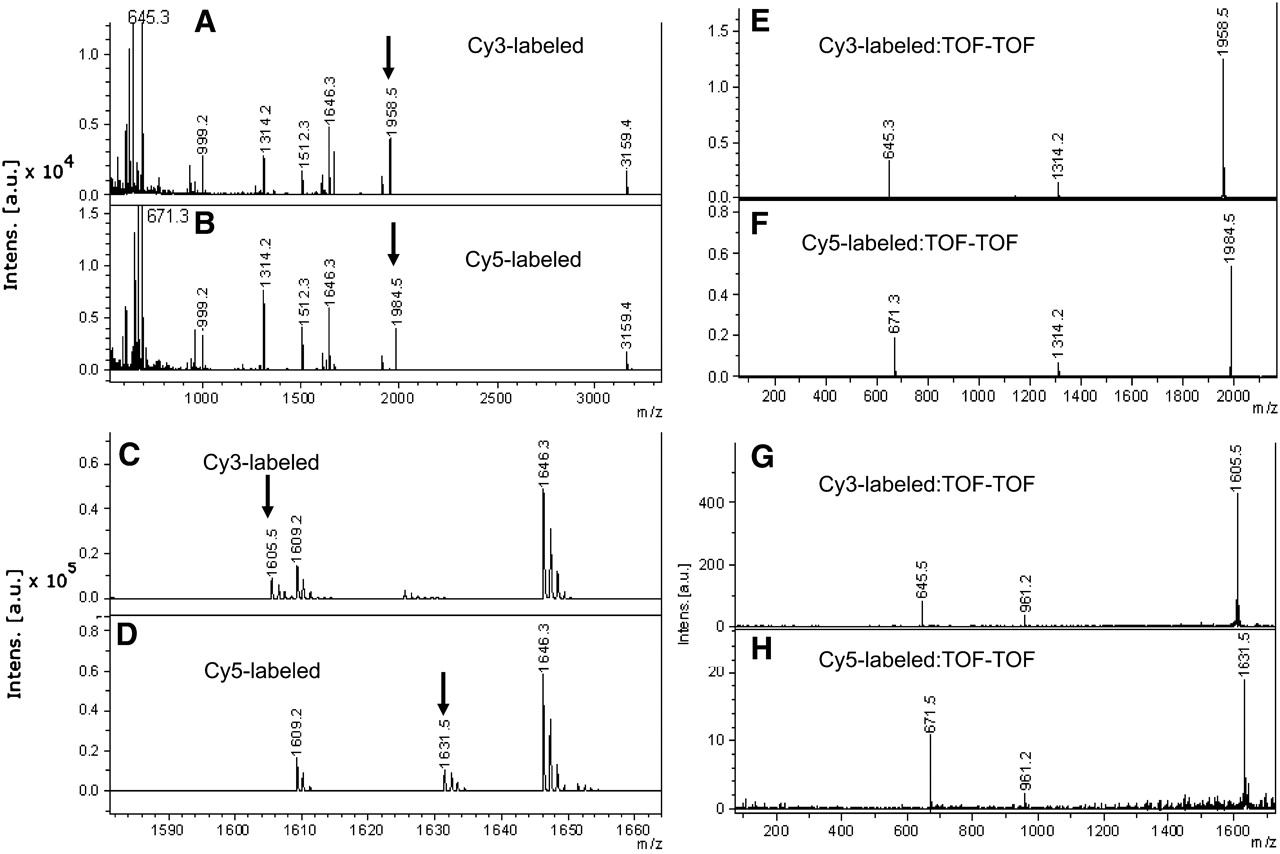
FIGURE 4.
MALDI and TOF-TOF analyses of RNase T1 digests of reduced and labeled tRNAArg. (A–D): MALDI analyses—arrows indicated new peaks observed on digestion of labeled tRNAArg. (A) Major peaks, Cy3-labeled tRNAArg; (B) major peaks, Cy5-labeled tRNAArg; (C) detail of 1600–1660 m/z region, Cy3-labeled tRNAArg; (D) detail of 1600–1660 m/z region, Cy5-labeled tRNAArg. (E–H): TOF-TOF analyses: (E) 1958.5 m/z peak in A; (F) 1984.5 m/z peak in B; (G) 1605.5 m/z peak in C; (H) 1631.5 m/z peak in D.




