Fluorescent labeling of tRNA dihydrouridine residues: Mechanism and distribution

(Downloading may take up to 30 seconds. If the slide opens in your browser, select File -> Save As to save it.)

Click on image to view larger version.

FIGURE 3.
FIGURE 3.

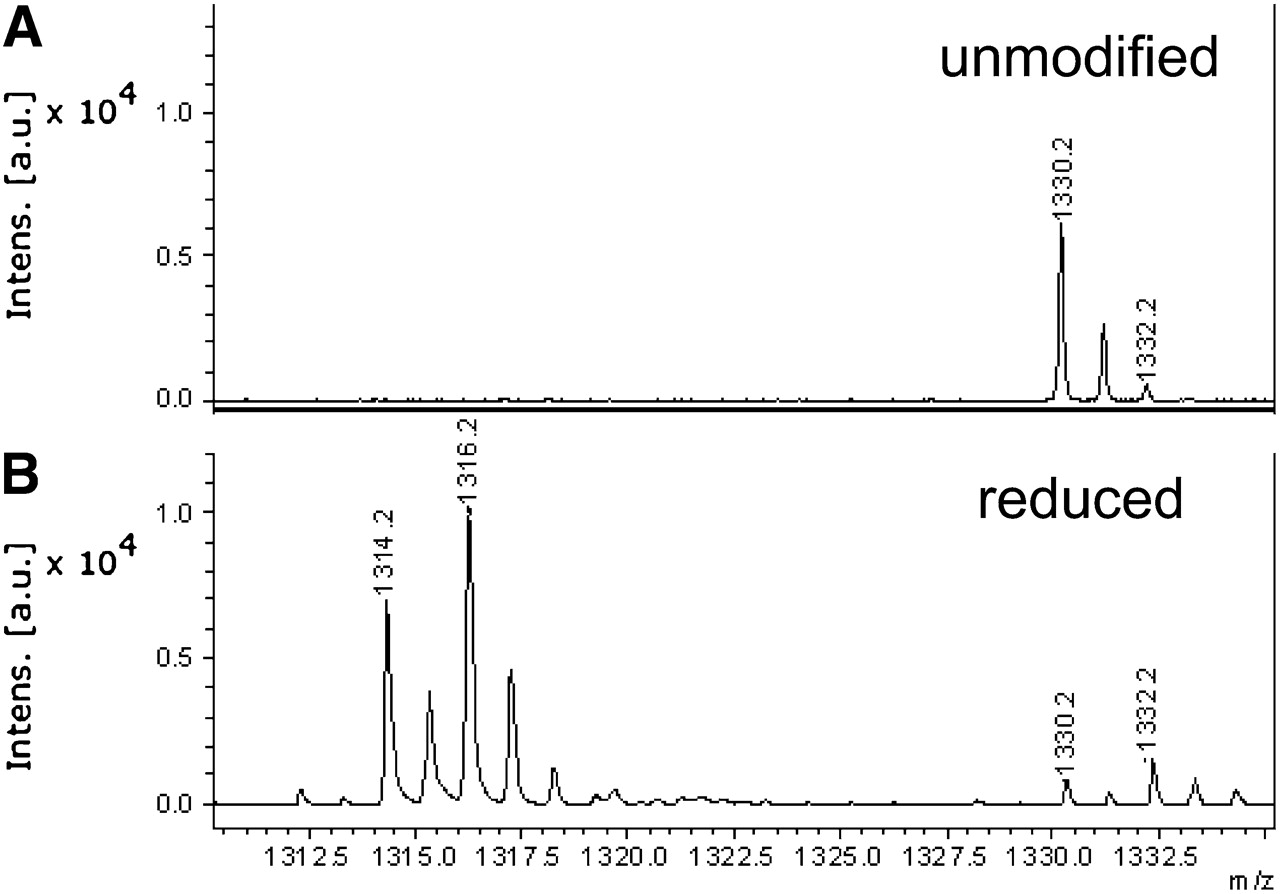
MALDI analyses of RNase T1 digests of unmodified tRNAArg and NaBH4-reduced tRNAArg. (A) Unmodified tRNAArg, showing detail of 1310–1335 m/z region and 1330 peak corresponding to unmodified AD20aAG 3′P; (B) same as A, but for NaBH4-reduced tRNAArg.

This Article

  1. RNA 17: 1393-1400

