


miTALOS: Analyzing the tissue-specific regulation of signaling pathways by human and mouse microRNAs
Abstract
MicroRNAs (miRNAs) are an important class of post-transcriptional regulators of gene expression that are involved in various cellular and phenotypic processes. A number of studies have shown that miRNA expression is induced by signaling pathways. Moreover, miRNAs emerge as regulators of signaling pathways. Here, we present the miTALOS web resource, which provides insight into miRNA-mediated regulation of signaling pathways. As a novel feature, miTALOS considers the tissue-specific expression signatures of miRNAs and target transcripts to improve the analysis of miRNA regulation in biological pathways. MiTALOS identifies potential pathway regulation by (i) an enrichment analysis of miRNA targets genes and (ii) by using a proximity score to evaluate the functional role of miRNAs in biological pathways by their network proximity. Moreover, miTALOS integrates five different miRNA target prediction tools and two different signaling pathway resources (KEGG and NCI). A graphical visualization of miRNA targets in both KEGG and NCI PID signaling pathways is provided to illustrate their respective pathway context. We perform a functional analysis on prostate cancer-related miRNAs and are able to infer a model of miRNA-mediated regulation on tumor proliferation, mobility and anti-apoptotic behavior. miTALOS provides novel features that accomplish a substantial support to systematically infer regulation of signaling pathways mediated by miRNAs. The web-server is freely accessible at http://hmgu.de/cmb/mitalos.
Keywords
INTRODUCTION
MicroRNAs (miRNAs) are endogenous, nonprotein coding, 18–25 nucleotide RNA molecules playing an important role in post-transcriptional regulation (Valencia-Sanchez et al. 2006). They mostly target the 3′-untranslated region of a target mRNA, thereby destabilizing the transcript (Guo et al. 2010) and inhibiting its translation (Filipowicz et al. 2008). It has been shown that miRNA expression and maturation are induced by signaling pathways (O'Connell et al. 2007; Davis et al. 2008; Suzuki et al. 2009). A number of recent studies have also identified miRNAs as important regulators of signaling pathways (Kennell et al. 2008; Leucht et al. 2008; Ricarte-Filho et al. 2009). Given the large number of miRNA targets (Lewis et al. 2005), it can be assumed that miRNAs regulate not only a single important pathway protein, but rather coordinate protein levels on a pathway-wide scale. Deregulated miRNA levels might result in altered target transcript levels, consequently fallacious signal transduction, and potentially a disease phenotype (Thum et al. 2008). Merging several single functional studies leads to a wealth of possible principles of miRNA mediated control on signaling pathways (for review, see Inui et al. 2010). In order to predict the impact of a specific miRNA on a signaling pathway, we have to understand the principles of miRNA-mediated regulation and analyze the target patterns to predict an miRNA pathway interaction from a functional perspective (Cui et al. 2006; Tsang et al. 2007; Kowarsch et al. 2010).
Even though their biological impact is obvious, only few miRNA target relations have been experimentally identified. The miRTarBase database (Hsu et al. 2010) with more than 3576 experimentally supported miRNA target interactions provides the most comprehensive collection, with, in total, 657 miRNAs in 17 organisms. Although new high-throughput methods, such as Hits-Clip (Chi et al. 2009) or Par-Clip (Hafner et al. 2010), are developed, target prediction mostly based on complementary sequences of miRNAs and mRNAs still provides a common way to identify potential target sites.
Currently, only a few resources are available that link miRNAs and biological pathways. MiRDB (Wang 2008) is an miRNA target prediction web resource that also provides precompiled information about single miRNA regulators. MiRGator (Nam et al. 2008) offers functional annotation of miRNA targets, as well as mapping of single miRNAs in pathways. DIANA-mirPath (Papadopoulos et al. 2009) integrates miRNA targets in Kyoto Encyclopedia of Genes and Genomes (KEGG) (Kanehisa et al. 2008) pathways and provides three different target prediction tools.
It has already been shown that many miRNAs exhibit temporal and tissue-specific expression patterns (Lau et al. 2001), destabilizing many transcripts to further define tissue-specific transcript profiles (Farh et al. 2005). However, miRNA prediction algorithms do not take expression profiling of both miRNA and mRNA levels into account. Therefore, functional analysis on the global set of predicted targets may lead to wrong miRNA-pathway associations. Based on the highly tissue-specific expression signatures of miRNAs and target transcripts, tissue-specific gene expression has to be considered to improve the analysis of miRNA regulation in biological pathways. We have therefore developed miTALOS, an interactive tool that integrates tissue and pathway filters to restrict the functional analysis as the first publicly available resource. MiTALOS performs an enrichment and proximity analysis of predicted target genes in signaling pathways. The widely applied enrichment analysis uses the number of target genes in a specific signaling pathway to infer miRNA-pathway associations (Xu and Wong 2008; Hafner et al. 2010; Kowarsch et al. 2010). As the enrichment analysis focuses on the whole signaling pathway as a set of genes without taking its topology into account, subcascade-specific relations between miRNAs and pathways are ignored. In order to cover these interactions, miTALOS provides a second approach based on the network proximity of miRNA targets. As there is strong evidence that miRNAs can act in concert with each other in order to affect a signaling pathway (Ivanovska and Cleary 2008), miTALOS addressed this aspect through the simultaneous analysis of multiple miRNAs or even predefined genomic miRNA clusters. In addition, target genes and miRNAs are linked to external databases to offer additional information. Finally, graphical visualization of the miRNA targets in a given pathway allows functional insights into miRNA-dependent regulation of signaling pathways.
RESULTS AND DISCUSSION
miTALOS: Workflow of the functional analysis
The miTALOS web resource provides insight into the tissue-specific regulation of signaling pathways mediated by miRNAs. First, single or multiple miRNAs can be analyzed by miTALOS, whereby the input data can also be selected from a list of predefined genomic miRNA clusters (Step 1) (see Fig. 1A). Several studies indicated that not only deregulated single miRNAs but also miRNA clusters, such as miR-17-92 (Kim et al. 2009), miR-106b-25, and miR-222-221 (Mendell 2008), have a strong impact on signaling transduction and corresponding phenotypes. It is well established that many miRNAs are limited in their expression to certain stages in development, tissues, and cell types (Bartel 2004). To address this issue, miTALOS is the first resource that provides an additional tissue filter (Step 2). We mapped the predicted miRNA target transcripts on the tissue atlas data from Su et al. (2002) providing the expression patterns for 79 human and 61 mouse tissues. MiTALOS offers two different resources of signaling pathways. All nonmetabolic human and mouse pathways were integrated from the KEGG (Kanehisa et al. 2008). For the analysis of human miRNA regulation, we also included pathway information from the National Cancer Institute Pathway Interaction Database (NCI PID) (Schaefer et al. 2009). In addition to the tissue filter, miTALOS also provides a pathway filter to restrict the functional analysis. miRNA target transcripts are obtained from five different prediction tools: TargetScanS (Lewis et al. 2005), RNA22 (Farh et al. 2005), PicTar (Krek et al. 2005), PiTa (Kertesz et al. 2007), and TargetSpy (Sturm et al. 2010). Due to imperfect base pairing and the short length of binding sites, prediction of miRNA target genes often yields false positive target genes. It has already been shown that the intersection of the prediction tools can yield improved specificity with only a marginal decrease in sensitivity relative to any individual algorithm (Sethupathy et al. 2006). To address this issue, miTALOS provides the ability to generate intersections from two to five prediction tools (Step 3) (see Fig. 1A). By default, miTALOS presents miRNA-pathway associations having a P-value <0.05. An intuitive option menu allows the user to modify all parameters (enrichment, proximity cutoffs, and P-values).
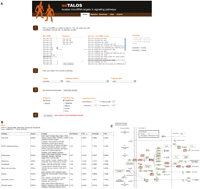
Overview of the miTALOS web resource. (A) After selecting single or multiple miRNAs (which can also be chosen from a list of predefined genomic miRNA clusters) as input, the user can restrict the analysis to a specific tissue and/or pathway. In addition, miRNA prediction methods and output parameters, such as P-value cutoffs can be defined. (B) The result page shows the identified miRNA-pathway associations. By default, miTALOS sorts all pathways by an increasing enrichment P-value along with the names of each miRNA's target genes involved in either KEGG or NCI PID pathways. Multiple sorting options and links to disease association are provided. (C) miRNA target genes in a given pathway are graphically annotated (highlighted in red boxes) in the pathway map.
The result web page lists all identified miRNA-pathway associations (see Fig. 1B). MiTALOS sorts all pathways by increasing enrichment P-value along with the names of each miRNA's target genes involved in either KEGG or NCI PID pathways. Target genes are linked to the Universal Protein Resource (Uniprot) (Apweiler et al. 2004). MiTALOS also links queried miRNAs to disease associations obtained from the PhenomiR database (Ruepp et al. 2010), which is a manually curated database of differentially regulated miRNA expression in diseases and other biological processes. The result page also provides multiple sorting options for the user. Finally, miRNA target transcripts located in a given pathway are graphically annotated onto the pathway map (see Fig. 1C), which is also linked to the result page.
MiTALOS uses a MySQL database to store pathways from KEGG and NCI and tissue-specific expression data from the tissue atlas. miRNA predictions and random samplings for all pathways are precomputed and stored in separate database tables. The database structure allows updates to pathways and miRNA targets independently. The integration of external resources, such as miRBase, KEGG, NCI or target prediction tools is automated and will be updated whenever these resources have a new major release. Calculation of the enrichment and proximity score is performed on-the-fly and makes use of the precomputed data. We are thereby able to offer highly responsive computations of miRNA-pathway associations based on the most recent biological knowledge. MiTALOS is based on Java EE and running on a Tomcat servlet container. The business logic is implemented with servlets and additional Java libraries while Java ServerPages are used to present the data. AJAX capabilities are added with jQuery, a comprehensive JavaScript library.
Identification of miRNA-pathway associations
miTALOS analyzes miRNA-mediated regulation of signaling pathways using two different approaches. A first approach uses the number of miRNA targets in a specific signaling pathway to calculate an enrichment score, as widely applied in various applications (Xu and Wong 2008; Hafner et al. 2010; Kowarsch et al. 2010; Liu et al. 2010). The enrichment score assumes that miRNAs target-specific signaling pathways to influence-specific functions of the cell by the sheer number of target transcripts. The enrichment score is then defined as the fraction of target genes compared to the expected number of target genes in a given pathway. The significance is obtained with Fisher's exact test (Fisher 1922), corrected by the Benjamini–Hochberg procedure (Benjamini and Hochberg 1995) (see Materials and Methods for a detailed description). Signaling pathways often have different cascades activated by different stimuli. As the enrichment method focuses on the whole pathway, subcascade-specific relations between miRNAs and signaling pathways are ignored. To cover these miRNA-pathway associations, we developed a second approach based on the network proximity of miRNA targets in signaling pathways. We assume that miRNAs target signaling cascades in a proximal manner. To reveal signaling pathways with proteins that function in a proximal manner and are targeted by the same miRNA, we introduce the proximity measure. We determine the distances between all pairs of targets in the corresponding signaling pathway. For each target, the minimal distance is chosen and the proximity score is defined as the mean of all minimal distances (see Materials and Methods for a detailed description).
Difference between miRNA enriched and proximal pathways
In contrast to the proximity measure, the enrichment measure relies on the assumption that miRNA control on a pathway is mediated by the number of targets. As there is evidence that miRNAs have a strong impact on the signal transduction, the degree of down-regulation often tends to be quantitatively modest. An miRNA typically down-regulates most of its target transcript by <50% (Baek et al. 2008). This consideration suggests that although many genes are predicted to be miRNA targets, only a fraction of these interactions will have an impact on biological responses and phenotypes (Li and Carthew 2005). Analyzing the distribution of the number of targets in signaling pathways (KEGG pathways and TargetScanS), the result shows the highest miRNA target density for one to eight targets per pathway (see Fig. 2) reflecting 90% of all miRNA-pathway associations.
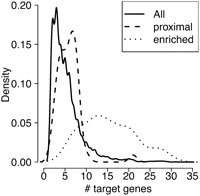
Proximity vs. enrichment in signaling pathways. Density of the number of targets in miRNA-pathway associations (solid line). Although the number of targets in a significantly enriched (FDR < 0.01) pathway is mainly between 10 and 20 (dotted line), significantly proximal (FDR < 0.01) targeted pathways have three to seven targets (dashed line). Thus proximity and enrichment score identify two alternative forms of miRNA control.
Applying the enrichment method, we obtained 265 significant miRNA-pathway associations (FDR < 0.01). We analyzed the number of targets in significantly enriched pathways and obtained mainly between 10 and 20 target transcripts per signaling pathway (see Fig. 2). This result indicates that the enrichment approach mainly focuses on a small subpart of miRNA-pathway associations that only reflects 7% of the total associations. Therefore, it can be argued that the enrichment approach identifies signaling pathways having, in general, transcripts under miRNA control. Therefore, the basic hypothesis behind the enrichment concept might be unsound: Often, it suffices for an miRNA to regulate a small subpart or even a single transcript in order to influence the function of a whole pathway (Kennell et al. 2008; Leucht et al. 2008; Ricarte-Filho et al. 2009). This assumption is also affirmed by our finding reflecting that miRNAs target, in general, a small amount of pathway player (Fig. 2).
In order to assess these signaling components of miRNA-mediated control, we introduced the proximity measure that calculates the proximity of miRNA targets in signaling pathways based on the distance of the miRNA targets in a pathway. Using this method, we obtained a set of 125 significantly proximal (FDR < 0.01) miRNA-pathway associations. This set of miRNA-pathway associations has the highest density for three to seven targets per pathway (Fig. 2). Apparently, the two measures identify significant miRNA-pathway associations with very different target abundances. Thus, proximity and enrichment scores identify two alternative forms of miRNA control. The proximity method (mean number of miRNA targets per pathway [mtpp] = 5.90) is clearly shifted to a smaller number of target transcripts compared to the enrichment method (mtpp = 15.31; P < 2.2–16). Comparing the proximity method with the distribution of all miRNA-pathway associations (mtpp = 5.40), shows that the proximity-based approach focused on miRNA-pathway associations that are in general more common.
Case study: miRNAs in prostate cancer
Recent studies have supported that miRNA mutations or deregulation are associated with various human cancers indicating that miRNAs can function as tumor suppressors and oncogenes (Zhang et al. 2007; Medina et al. 2010). Prostate cancer is one of the most significant cancers and second leading cause of cancer death among American men, exceeded only by lung cancer (American Cancer Society 2002; NIH 2002). In order to unveil the impact and interaction of miRNAs with the important and altered signaling pathways in prostate cancer, we performed a functional analysis with miTALOS using miR-106b-93-25, miR-22, TargetScanS, and the prostate expression profile as a tissue filter. A putative oncogenic function was proposed for the miR-106b-25 cluster and miR-22 in prostate cancer (Ambs et al. 2008; Poliseno et al. 2010). It was found that miR-22 operates as a proto-oncogene in combination with c-MYC (Poliseno et al. 2010) and plays an important role in retardation of tumor cells (Xiong et al. 2010). For cluster miR-106b-25, recent studies proposed an anti-apoptotic role in prostate cancer (Gandellini et al. 2009; Kan et al. 2009).
We performed a functional analysis with miTALOS using the miR-106b-25 cluster, miR-22, prostate tissue filter, and TargetScanS (see Table 1). One feature of miTALOS is the ability to use intersections of miRNA prediction tools that can improve the target gene specificity. We therefore also applied miTALOS using the intersection of TargetScanS and PicTar, which shows a good performance and achieved just slightly less sensitivity than either program individually (Sethupathy et al. 2006). Further, we used the intersection of two prediction methods (PicTar and RNA22), which are based on different features, to illustrate the scope of miTALOS (for a complete list of identified miRNA-pathway associations see Table 1).
Enriched and proximal pathways identified by miTALOS using different miRNA prediction tools and the prostate tissue filter
Using miTALOS, we obtained a significant enrichment (P < 0.05) of miRNA target genes in KEGG's prostate cancer pathway independently by the chosen prediction set. This pathway summarizes key molecular alterations in prostate cancer in a combined pathway. The result shows that the queried miR-NAs have a strong impact on critical components of the phenotype of prostate cancer. In addition, miTALOS identifies an enrichment of target genes in an actin cytoskeleton pathway indicating the association between the queried miRNAs and cell motility in prostate cancer. Cell motility is a critical determinant of prostate cancer metastasis (Donald et al. 2001). RHO/ROCK kinase induces reorganization of the actin cytoskeletal dynamics in several metastatic tumors (Malliri and Collard 2003). Zohrabian et al. (2009) showed that a down-regulation of ERK leads to increased cell migration. We found ERK and GRLFI targeted by miR-106b-25 indicating the influence of the prostate-related miRNAs on the repression of ROCK and therefore the activation of cell migration (see Fig. 3A).
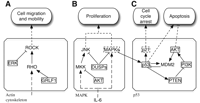
Model for central prostate cancer-related processes and their miRNA-mediated regulation. Solid-framed transcripts are predicted targets by miR-106b-25 cluster and/or miR-22. Dashed-framed transcripts are validated miRNA target genes. Arrows indicate activation, dashed lines inducement, and blunted arrows inhibition. (A) RHO/ROCK (RHO kinase) signaling regulates actin cytoskeletal dynamics in several metastatic tumors (Malliri and Collard 2003). ERK/MAPK regulates the actin cytoskeleton and contraction required to drive cell motility, whereas a down-regulation of ERK leads to cell migration (Zohrabian et al. 2009). We found ERK and GRLF1 targeted by miR-106b-25. (B) IL-6 mediated cell proliferation via activation of the MAPK pathway. Down-regulation of AKT and DUSP lead to an activation of MKK/JNK (Farooq and Zhou 2004), which is required for the growth of prostate carcinoma (Shimada et al. 2007). We found inhibitors such as AKT and DUSP targeted by miR-106b-25 and miR-22 indicating the oncomir character of the queried miRNAs. (C) Activation of the p53 pathway is induced by MAPK. The p53 pathway is actively involved in cell-cycle arrests and p53-dependent apoptosis (Scott et al. 2003; Cano et al. 2009). We found central players of cell-cycle arrest targeted by miR-106b-25 and miR-22. Ivanovska et al. (2008) showed that p21 is a direct target of miR-106b and that its silencing plays a key role in cell-cycle progression by modulating check point functions.
Further, we identify an association between miR106b-25, miR-22, and the MAPK pathway using TargetScanS. IL-6 activates prostate cancer cell proliferation via JAK-STAT (Ueda et al. 2002) and MAPK (Shida et al. 2007) pathways (see Fig. 3B). The association between JAK-STAT and the queried miRNAs, however, was only found by an intersection-based miRNA target set based on PicTar and RNA22, whereas no single prediction tool was able to identify a significant relationship. This result shows that a search using more the one prediction method leads to biologically relevant results.
Down-regulation of AKT and DUSP leads to an activation of the MKK/JNK cascade, which is involved in the tumor growth in prostate cancer (Shimada et al. 2007). MiTALOS identifies inhibitors such as AKT, DUSPs, and MAPKs targeted by miR-106b-25 and miR-22. In addition, MAPK9 is a validated target gene of miR-93 (Mouillet et al. 2010). The result of miTALOS shows that central inhibitors of the MAPK-related proliferation are under miRNA-mediated repression, which may facilitate tumor proliferation (see Fig. 3B).
In addition, miTALOS links the queried miRNAs to the cell cycle and Phosphatidylinositol pathways. In prostate cancer, the PI3K/AKT signaling cascade is activated to ensure cell survival and protection against apoptosis (Shukla et al. 2007). It was shown that the Wnt signaling is involved in AKT activation (Yardy and Brewster 2005), which inhibits angiogenesis and tumor growth (Fang et al. 2007). Moreover, there is in vivo evidence that the ErbB family receptors activate the PI3K/Akt/NF-kB pathway in prostate cancer cells (Grasso et al. 1997). Using miTALOS, we were only able to identify these miRNA-pathway associations by using an intersection based miRNA target sets. Within these pathways, which are in crosstalk to the PI3K/AKT signaling cascade, we identified PI3K and AKT targeted by the queried miRNAs in the related pathways. This result supports the activation of MAPK-related tumor growth and indicated the role of miR-106b-25 and miR-22 as oncomirs (see Fig. 3B). The p53 pathway was only found by our new proximity method (P < 0.05). P53 and cell-cycle-related pathways are active and involved in the lack of cell-cycle checkpoint arrests and p53-dependent apoptosis (Scott et al. 2003; Cano et al. 2009). DNA damage results in a sharp increase of p53 protein that, in turn, can enhance cell-cycle arrest and apoptosis. We identify central players of cell-cycle arrest targeted by miR-106b-25 and miR-22 independently of the prediction tool facilitating the inhibition of cell-cycle arrest and apoptosis (see Fig. 3C). In addition, Ivanovska et al. (2008) showed that p21 is a direct target of miR-106b and plays a key role in cell-cycle progression.
We summarized the miRNA-mediated regulation on tumor proliferation, mobility, and anti-apoptotic behavior of the prostate cancer-related miR-106b-25 and miR-22 in a model illustrated in Figure 3. The functional analysis and inferred model indicate that the global effect of the up-regulated miRNAs do not only depend on single central target genes, but also on the interaction of multiple components in the signaling pathways. We were able to show that the features of miTALOS provide a substantial support to infer miRNA-mediated regulation of signaling pathways in systematical manner.
CONCLUSION
We presented the miTALOS web server that provides novel features for the functional analysis of miRNA-mediated regulation in biological pathways. MiTALOS offers two different methods and pathway resources to identify signaling pathways altered by the expression of miRNAs. The two measures provide significant miRNA-pathway associations for two alternative forms of miRNA control. As miRNAs and their target genes show highly tissue-specific expression signatures, miTALOS provides a tissue filter. This is a novel feature in contrast to already existing resources, where the functional analysis is corrupted by targets that are not expressed in the tissue under consideration. In a functional analysis of prostate cancer-related miRNAs, we showed the benefit of the novel features to identify biological meaningful miRNA-pathway associations. Given the increasing amount of evidence that miRNAs have an important impact on signaling pathway regulation, miTALOS provides a substantial support to infer systematical insights of miRNA-mediated regulation.
MATERIALS AND METHODS
miRNA data
Human and mouse miRNAs were extracted from the miRBase database (Griffiths-Jones et al. 2008), which is a collection of published miRNA sequences and annotation. As there is strong evidence that miRNAs can act in concert with each other, miTALOS also provides a list of predefined miRNA clusters. miRNA clusters are defined as a set of miRNAs, where each member is having at least one other member of the same cluster within a 5-kb distance according to chromosomal locations. Chromosomal positions of all human and mouse miRNAs were obtained from the mirBase database.
miRNA target prediction
The miTALOS web resource uses several target prediction methods to infer miRNA target transcripts: TargetScanS (Lewis et al. 2005), RNA22 (Farh et al. 2005), PicTar (Krek et al. 2005), PiTa (Kertesz et al. 2007), and TargetSpy (Sturm et al. 2010). Sethupathy et al. (2006) showed that the intersection of the prediction tools can yield improved specificity with only a marginal decrease in sensitivity relative to any individual algorithm. MiTALOS can handle this issue by generating intersections from at least two prediction methods. Hausser et al. (2009) analyzed different features of miRNA targets and showed that TargetScanS has the best performance on different data sets. Therefore, TargetScanS was defined as the default prediction method for miTALOS and used for the case study.
Tissue expression profiles
miRNA and their corresponding target transcripts show a highly tissue-specific expression pattern. We used the tissue atlas provided by Su et al. (2004) to filter potential miRNA targets in a specific tissue. The human and mouse data were downloaded from the NCBI Gene Expression Omnibus (GEO) and the processed data were used. We mapped the predicted miRNA target transcripts on the tissue atlas and considered a transcript as expressed in a specific tissue, if either one replicate has a present call or both show at least a marginal call, similar to the method used by McClintick and Edenberg (2006).
Signaling pathways
For the functional analysis of miRNA-pathway associations, miTALOS offers two different resources of signaling pathway. All nonmetabolic pathways for human and mouse were integrated from the Kyoto Encyclopedia of Genes and Genomes (KEGG) (Kanehisa et al. 2008). The KEGG Pathway database is a collection of manually curated pathway maps for various genomes. For the analysis of human miRNA regulation, we also included signaling pathway information from the National Cancer Institute Pathway Interaction Database (NCI PID) (Schaefer et al. 2009). NCI PID is a manual collection of biomolecular interactions and key cellular processes assembled into signaling pathways. The database is curated by Nature Publishing Group editors and reviewed by experts in the field.
Enrichment score
The identification of miRNA-pathway associations by miTALOS is obtained using two different approaches. The first approach
uses the number of target genes in a specific pathway to calculate an enrichment score. Here, we assume that miRNAs target-specific
pathways to influence-specific functions of the cell by the sheer number of target transcripts. Calculating the enrichment
of targets TPi in a pathway i with Pi proteins leads to an enrichment score E, which has been used in previous studies: where TPi is the number of targets in pathway i, Pi is the number of all proteins in pathway i, TP is the number of all targets in all pathways, and P the number of all proteins in the KEGG or NCI PID pathways. The significance is obtained by Fisher's exact test (Fisher 1922), corrected by the Benjamini–Hochberg procedure (Benjamini and Hochberg 1995).
Proximity score
We assume that some miRNAs target signaling cascades in a proximal manner. To reveal pathways with proteins that function
in a proximal manner and are targeted by the same miRNA, we introduce a proximity measure P. Let us consider a pathway i with Pi proteins and TPi targets of a specific miRNA; we can determine the distances dxy between all TPi(TPi − 1)/2 pairs of targets x, y (x≠y) in the corresponding signaling pathway. To condense this set of distances for an miRNA pathway pair into a real number in
[0, 1], we calculate the minimal distance for each target x. The proximity score P is then defined as the mean of all minimal distances TdxyU as the power of base α. The proximity score P is the defined as The base α can be chosen appropriately to ensure a reasonable separation of the distances occurring in the network. Based
on the observed distance scores, we chose α = 1.1. In order to obtain significant miRNA-pathway associations we perform random
sampling. For each pathway i and specific number of targets, we randomly choose 10,000 times miRNA targets and calculate the corresponding proximity scores
P. These samplings are then used to calculate the P-values by counting the number of proximity scores that are less than the original score divided by 10,000. Final P-values were then corrected by the Benjamini–Hochberg procedure.
The base α can be chosen appropriately to ensure a reasonable separation of the distances occurring in the network. Based
on the observed distance scores, we chose α = 1.1. In order to obtain significant miRNA-pathway associations we perform random
sampling. For each pathway i and specific number of targets, we randomly choose 10,000 times miRNA targets and calculate the corresponding proximity scores
P. These samplings are then used to calculate the P-values by counting the number of proximity scores that are less than the original score divided by 10,000. Final P-values were then corrected by the Benjamini–Hochberg procedure.
ACKNOWLEDGMENTS
We thank Andreas Ruepp for critical comments and proofreading of the manuscript and Jörg Bartel for technical support. This work was supported by the Federal Ministry of Education and Research (BMBF) and its MedSys initiative (projects “LungSys”), the Helmholtz Alliance on Systems Biology (project “CoReNe”), and by the German Science Foundation (DFG) within the SPP 1395 (InKoMBio).
Footnotes
-
Reprint requests to: Andreas Kowarsch, Insitute for Bioinformatics and Systems Biology, Helmholtz Zentrum München, 85764 Neuherberg, Germany; e-mail: andreas.kowarsch{at}helmholtz-muenchen.de; fax: 49-89-31873585; or Fabian J. Theis, Insitute for Bioinformatics and Systems Biology, Helmholtz Zentrum München, 85764 Neuherberg, Germany; e-mail: fabian.theis{at}helmholtz-muenchen.de.
-
Article published online ahead of print. Article and publication date are at http://www.rnajournal.org/cgi/doi/10.1261/rna.2474511.
- Received September 28, 2010.
- Accepted February 7, 2011.
- Copyright © 2011 RNA Society




