


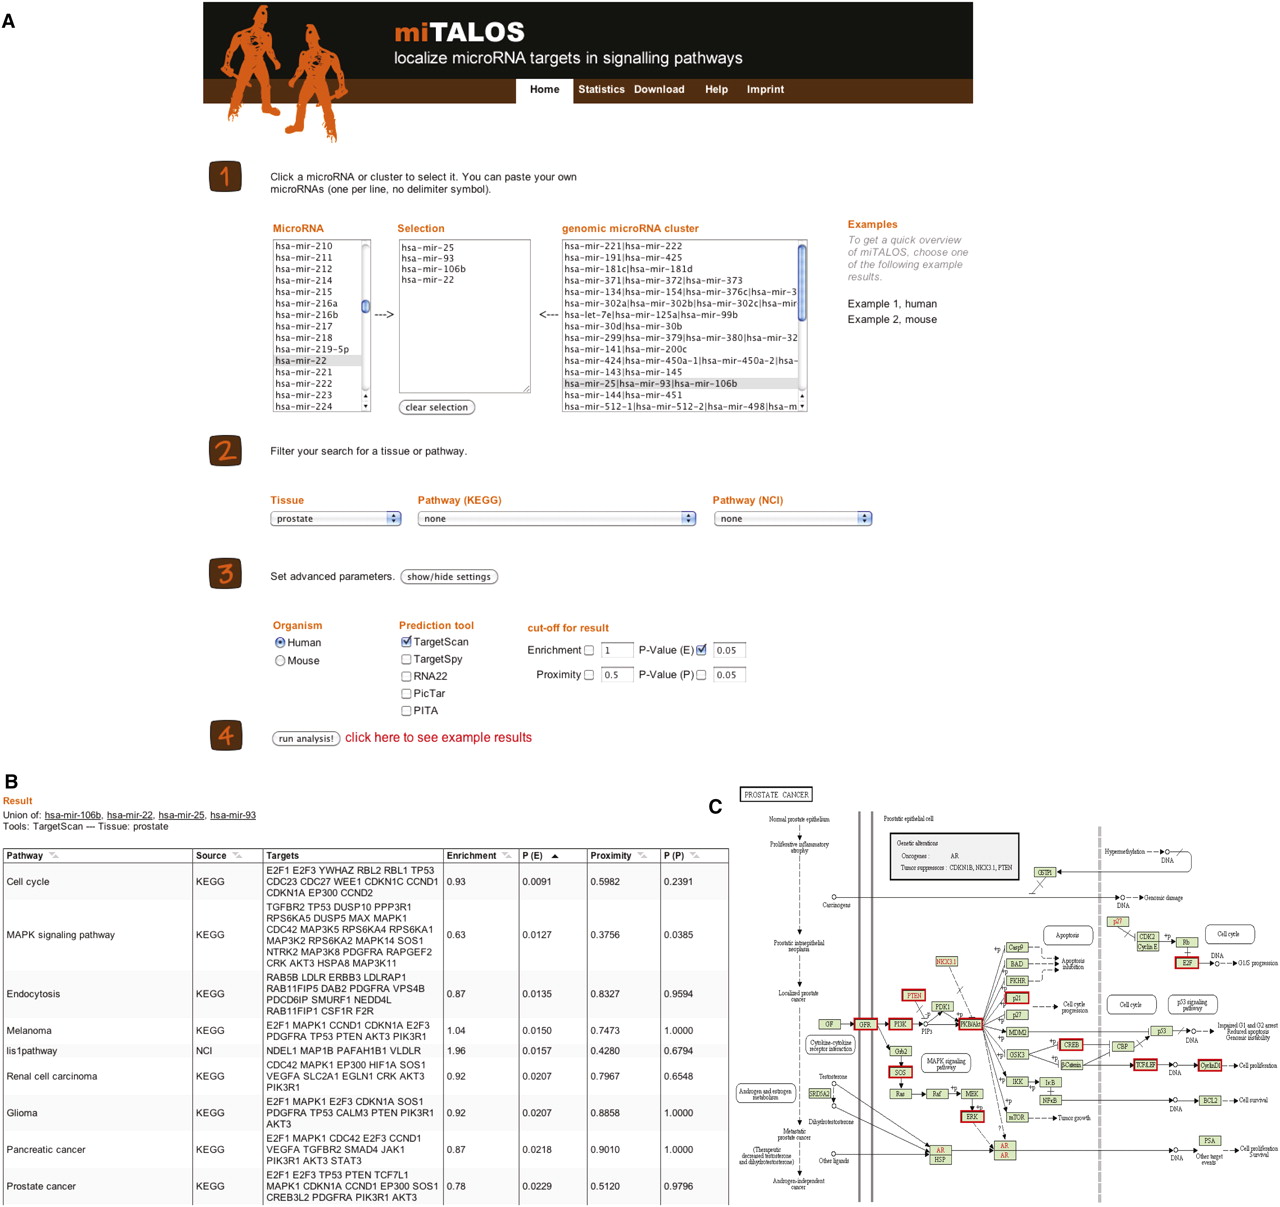
Overview of the miTALOS web resource. (A) After selecting single or multiple miRNAs (which can also be chosen from a list of predefined genomic miRNA clusters) as input, the user can restrict the analysis to a specific tissue and/or pathway. In addition, miRNA prediction methods and output parameters, such as P-value cutoffs can be defined. (B) The result page shows the identified miRNA-pathway associations. By default, miTALOS sorts all pathways by an increasing enrichment P-value along with the names of each miRNA's target genes involved in either KEGG or NCI PID pathways. Multiple sorting options and links to disease association are provided. (C) miRNA target genes in a given pathway are graphically annotated (highlighted in red boxes) in the pathway map.




