


Plant noncoding RNA gene discovery by “single-genome comparative genomics”
Abstract
Plant genomes have undergone multiple rounds of duplications that contributed massively to the growth of gene families. The structure of resulting families has been studied in depth for protein-coding genes. However, little is known about the impact of duplications on noncoding RNA (ncRNA) genes. Here we perform a systematic analysis of duplicated regions in the rice genome in search of such ncRNA repeats. We observe that, just like their protein counterparts, most ncRNA genes have undergone multiple duplications that left visible sequence conservation footprints. The extent of ncRNA gene duplication in plants is such that these sequence footprints can be exploited for the discovery of novel ncRNA gene families on a large scale. We developed an SVM model that is able to retrieve likely ncRNA candidates among the 100,000+ repeat families in the rice genome, with a reasonably low false-positive discovery rate. Among the nearly 4000 ncRNA families predicted by this means, only 90 correspond to putative snoRNA or miRNA families. About half of the remaining families are classified as structured RNAs. New candidate ncRNAs are particularly enriched in UTR and intronic regions. Interestingly, 89% of the putative ncRNA families do not produce a detectable signal when their sequences are compared to another grass genome such as maize. Our results show that a large fraction of rice ncRNA genes are present in multiple copies and are species-specific or of recent origin. Intragenome comparison is a unique and potent source for the computational annotation of this major class of ncRNA.
Keywords
INTRODUCTION
Modern plant genomes are the result of multiple events of tandem, large segmental and whole-genome duplications (Yu et al. 2005; Freeling 2009). Among the latter category, accidental polyploidization events (the joining of two or more genomes in the same nucleus) that occurred repeatedly during plant evolution were particularly potent sources of duplications that shaped all known plant genomes. As a result, multiple regions of conserved synteny are present that contain homologous protein-coding genes as well as noncoding elements. Following duplication, protein-coding genes may either undergo pseudogenization leading to gene loss, or may acquire different functions through processes known as neofunctionalization (new function) or subfunctionalization (specialization of function) (Ohno 1970; Semon and Wolfe 2007). The noncoding elements that lie in duplicated regions should in principle meet similar fates. These elements include matrix attachment regions; chromosome-level regulatory regions such as replication origins, promoter and enhancer elements, intron- and UTR-based regulation elements; and, importantly, genes for noncoding RNAs such as snoRNAs or miRNAs.
A useful concept for the study of functional noncoding elements is that of Conserved Noncoding Sequence, or CNS (Kaplinsky et al. 2002; Inada et al. 2003). A CNS is loosely defined as non-protein-coding sequence whose conservation stands above background in alignments of homologous regions from different species. Previous studies have focused on discovering CNSs located within known protein-coding genes (such as regulatory intronic and UTR elements) and on associating CNSs to functional biases in flanking genes. Estimates of CNS contents of genomes vary greatly depending on the prediction method used, from a few units to dozens per gene (Kaplinsky et al. 2002; Inada et al. 2003; Lockton and Gaut 2005). It is generally recognized, however, that plants have significantly fewer CNSs than animals. Regarding functional studies in plants, it has been established that rice CNSs occur preferentially in the vicinity of regulatory genes, while housekeeping and metabolic genes have fewer CNS (Inada et al. 2003).
Given the large number of duplications in plant genomes, a significant fraction of functional noncoding elements in plants is located in duplicated regions. How did these elements evolve following duplication? Natural selection should act similarly on noncoding and coding elements, thus causing element loss or conservation. Therefore, we can expect that comparing duplicated segments from the same genome should reveal footprints of functional non-conserved elements just like interspecies comparison does. Thomas et al. (2007) have sought such “intragenomic CNSs” in Arabidopsis and described approximately 15,000 CNSs, or about 1.7 per gene in duplicated regions. They confirmed the preferred occurrence of CNS around regulatory genes, suggesting that at least part of the intragenomic CNSs are selected for regulatory functions, similarly to intergenomic CNSs. “Single-genome comparative genomics,” however contradictory in terms, is therefore possible.
A major application of CNS analysis is the discovery of novel noncoding RNA (ncRNA) genes. As soon as alignable pairs of genomes were available, CNS collections were screened for ncRNAs (Rivas et al. 2001; Missal et al. 2005; Washietl et al. 2005a), and these studies contributed largely to the establishment of current ncRNA collections. Chen et al. (2009) have also taken advantage of unique features of whole-genome duplications in Paramecium to infer intragenomic CNSs and screen them for syntenic noncoding RNAs. Here, we question the value of comparative genomics to unravel ncRNAs in all duplicated plant regions, both local and large scale, using the rice genome as a proof of principle. If successful, this approach could be applied to discover ncRNAs in plant genomes for which no closely related genome is available for comparative genomics, but it could also be useful to detect RNAs that have no ortholog in available species.
RESULTS
Identification of noncoding repeats
We developed a protocol to identify repeated noncoding elements from a single genome (Fig. 1A; Materials and Methods). This protocol is intended to identify and cluster all DNA repeats that are not previously described as protein-coding exons or transposons or other known repeated elements, while also excluding repeats longer than 200 nt, for reasons explained in Materials and Methods. Note that potential long ncRNAs, which are known to exist in plants (Hirsch et al. 2006; Rymarquis et al. 2008), are not necessarily lost here, as they might be characterized by shorter conserved elements. To cluster the massive numbers of alignments produced by an “all against all” comparison of a large genome (producing in the order of 10 million significant local alignments), we introduce a simple distance function that determines how one region is conserved in all regions it aligns to. A graph is first generated (Fig. 1B), in which each vertex represents one aligned region and edges represent pairwise alignments. In contrast with clustering strategies that partition the graphs weighted by sequence similarity (Bejerano et al. 2004; Wong and Ragan 2008), we calculate the length of the conserved region for each node, and if the conserved region is shorter than 19 nt, the region is removed from the cluster, which breaks up all connections to this region. The empirical 19-nt cutoff corresponds to the shorter known ncRNAs. From an initial set of 31,313,363 significant local alignments, our procedure identified 122,853 repeat families. The length of repeat fragments ranges from 14 to 200 nt with a mean of 35 nt, and family size ranges from 2 to 219 with a mean of 2.6.
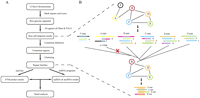
Strategy for the identification of repeated noncoding RNA families in rice. (A) General flow diagram. (B) Illustration of the consensus building and clustering algorithm. Different genomic regions are shown with different colors. Shadows in aligned regions represent conserved elements, noted “A cons,” “B cons,” and so on. Graphs show genomic regions as vertices (circled) and possible alignments as edges.
We analyzed the distribution of experimentally confirmed snoRNAs and miRNAs in these repeat families (Fig. 2A). Confirmed snoRNAs were obtained in part from our previous work (Chen et al. 2003), and from a new cloning and sequencing experiment that identified 40 additional H/ACA-box snoRNAs (see Materials and Methods; Supplemental File 1). Overall, more than half of the snoRNA and miRNA families are present in multiple copies. The majority of multicopy genes, but not all of them (58% for miRNA, 64% for snoRNAs), are present among repeat families. Interestingly, the recall ratio for known multicopy ncRNAs using intragenome comparisions (63% on average) (Fig. 2A) is similar to that obtained by comparing the rice genome to the maize genome (67% on average) (Fig. 2B). Therefore, single genome comparisons are potentially on a par with genuine comparative genomics methods for detecting members of multicopy families. Obviously, though, our method is unable to find singletons, whereas 39% of singletons can be recalled using intergenome comparisons (Fig. 2B).
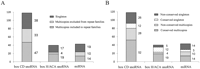
Distribution of confirmed ncRNAs in intragenome or intergenome conservations. (A) Intragenome conservation of ncRNAs. Box CD snoRNAs are from Chen et al. (2003), miRNAs are from Lu et al. (2008), and H/ACA snoRNAs were cloned in this study. (B) Conservation of rice ncRNAs in maize.
Fractions of confirmed RNA genes that belong to multicopy families (89% for miRNA, 82%–87% for snoRNA) (Table 1) are significantly higher in rice than in human, where only 35%–46% of ncRNA genes belong to multicopy families (Table 2). This difference between plants and animals reflects, albeit to a lesser extent, the one observed for protein-coding genes. In rice, 47% of protein-coding genes are in multicopy families, versus only 13.6% in human (Lockton and Gaut 2005). Comparing our results to those of Lockton and Gaut (2005) with protein-coding genes, it appears that the ratio of multicopy versus single-copy genes is higher for ncRNA than for protein. However, this needs to be confirmed as the difference may also be attributed to a difference in copy-detection stringency between the two studies.
Singletons and multicopy noncoding RNA families in rice
Singletons and multicopy noncoding RNA families in human
We used computational prediction to estimate the fraction of snoRNAs and miRNAs among repeat families. We predicted box H/ACA snoRNAs using ACAseeker (Yang et al. 2006) and snoGPS (Schattner et al. 2004), and box CD snoRNAs using CDseeker (Yang et al. 2006) and snoScan (Lowe and Eddy 1999). For miRNAs, we developed a plant-specific prediction pipeline described in Materials and Methods. The results are shown in Supplemental Figure S1. Overall, we expect about 130 new miRNA families, 40 box HACA snoRNA families, and 140 box CD snoRNA families overall among the repeats.
Identification of novel ncRNA repeats
In order to identify potential new ncRNA families among intragenomic repeats, we built a positive training set containing 140 trusted ncRNA families and a negative training set containing about 35,000 families of low complexity or non-ncRNA repeat regions. We trained a SVM model on this data set using the 15 characteristic features of repeat families listed in Table 3. We computed F-scores, which measure the discriminating power of features. Figure 3 shows F-score distributions for the five most significant features. The highest F-score is that of “deep sequencing data,” a parameter indicating that at least one member of the repeat family is supported by high-throughput sequencing reads from rna-seq experiments. The importance of this parameter was expected as it amounts to a direct experimental evidence of transcript expression. The feature with the second highest F-score is the RNAz P-value, which reflects the secondary structure conservation and free energy. The next two features, “size of family” and “length of candidate,” reflect a higher copy number and fragment length in genuine ncRNA repeats. The fifth feature, “size of the largest physical cluster,” describes genomic loci containing several members of the same repeat family, as observed, for instance, in several snoRNA and miRNA families. Expectedly, this parameter has a higher value for genuine ncRNAs. Another feature that ranked lower in the list was tiling array–based expression. That this parameter is less informative than deep sequencing data may be explained by a microarray probe selection process avoiding repeat regions and stable stem–loop structures, features that are quite frequent in ncRNAs.
Features used in SVM ranked by F score
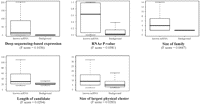
F-score distribution of the five most discriminating SVM features for ncRNA family prediction.
Our SVM classifier efficiently discriminates true ncRNAs from other repeats. The ROC curves in Figure 4A were obtained from 10 bootstrap samples of the training sets (see Materials and Methods). The average AUC (area under ROC curve) is 87.67%, which illustrates a high probability of our method classifying a randomly chosen family into the right class. Figure 4B shows the distribution of log-normalized SVM scores obtained on the whole set of 87,128 non-negative repeat families. At P-value ≥ 0.1 (i.e., normalized SVM score ≥ 0), 3979 repeat families from the non-negative data set are classified as ncRNA families. At this score threshold, there are 275 hits in the negative data set, which leads to infer approximately 670 expected false positives among the total 3979 predictions (17%). We will thereafter use the term “candidate ncRNA repeats” to describe those repeat families predicted to represent ncRNAs.
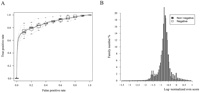
SVM-based ncRNA family predictions. (A) ROC curves from 10 SVM training bootstraps and average ROC curve. The bootstrap curves are shown dotted/gray, while the average curve is shown solid/red. Boxplots show vertical spreads around the average. (B) Distribution of repeat families based on log-normalized SVM score, for non-negative families and negative families. For each family, the score is averaged over 10 predictions using SVM models from the 10 bootstraps in A.
The complete set of candidate ncRNA repeats is presented in Supplemental File 2. As implied from the F-score results, candidate ncRNA repeats are, on average, significantly longer (90.1 nt vs. 37.3 nt) and found in more copies (family size of 3.0 vs. 2.5) than other repeats. Computational analysis of this data set using our pipelines for snoRNA and miRNA detection identifies 13 families of H/ACA soRNAs, 34 families of box CD snoRNAs, and 35 families of miRNAs among candidate ncRNA repeats. Overall, 11% (427) of the candidate ncRNA families are conserved in maize (Table 4). This is highly significant compared to 5% in other families (P = 4.14e-60); however, this also means that 89% of the repeat families would not generate a phylogenetic footprint when compared to this closely related plant genome. This again illustrates the value of intragenome comparison for phylogenetic footprinting and functional element identification.
Conservation analysis of repeat families
Candidate ncRNA repeats are significantly over-represented in introns and UTRs and under-represented in intergenic regions, compared to total repeats (Fig. 5). The difference is particularly significant in UTR regions (3.5-fold). There are, indeed, a number of ncRNAs processed from UTR regions; however, as rna-seq-based expression has an important weight in predicting the ncRNA status and since UTR sequences are over-represented in rna-seq reads, the increase of positive families in UTRs may partially reflect a scoring bias. Intronic locations are 2.5-fold higher in candidate ncRNA families, and this cannot be imputed to rna-seq as this method does not sequence introns. This finding further supports that introns are a fertile seedbed for noncoding RNAs, consistent with previous findings on rice box C/D snoRNAs, of which large numbers were found physically clustered in the introns of protein-coding genes (Chen et al. 2003). However, we observed no preference for ncRNA repeats to be associated with certain types of genomic duplications. Both candidate ncRNA and total repeats tend to occur more often in tandem than in segmental duplications, with an 80/20 ratio (Supplemental Fig. S2).
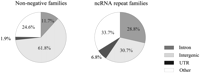
Physical location of repeats in non-negative (generic) repeat families and in candidate ncRNA repeat families. Item “mixed” refers to situations in which no single location is dominant among family members.
About 59% of the candidate ncRNA repeat families have an RNAz P ≥ 0.5. This means that sequences in these repeat families are capable of forming stable consensus secondary structures supported by significant conservation and covariation. The remaining repeats may thus be ncRNA with weak or poorly conserved secondary structure. There is no significant difference between the mean lengths of structural (high RNAz P-value) and non-structural ncRNA repeats; therefore, the lack of a conserved structure cannot be imputed to short elements that cannot form stable folds.
We analyzed in detail a selection of candidate ncRNA families. Figure 6A shows a family of 11 tRNA-like sequences named 67124.1 to 6724.11, with sizes ranging from 90 to 110 nt. tRNAscan-SE (Lowe and Eddy 1997) identifies eight members (IDs 6724.4 to 6724.11) as tRNATyr with a short intron of size 12–14 nt inserted in the anti-codon loop, and one repeat (ID 6724.2) as an intronless tRNAPhe. Two repeats (6724.1 and 6724.3) are possibly pseudo-tRNA genes due to the truncated TψC arm. This family is predicted as non-coding RNA with a very high SVM score (0.929). None of these tRNAs was included in the sequence set used to train the SVM model, which contained 39 rice tRNAs. However, we found subsequently that seven were already annotated as such in a recent version of the rice genome (Tanaka et al. 2008). Intriguingly, the tRNAPhe sequence is highly similar to that of the eight tRNATyr's except in the anticodon loop and acceptor stem, which are totally different from the ones in tRNATyr. Note that the rice genome contains several other tRNATyr and tRNAPhe genes similar to these, which are not captured in family 67124 but are captured in part in other families by our clustering procedure. Interestingly, the intron in the anticodon loop most likely predates duplication as it is found in all members of the family. The three unannotated elements include the two apparent pseudogenes and, for unknown reasons, one of the tRNATyr genes. This example shows that RNA families retrieved by our intra-species comparison protocol can even include distant members with lost or divergent functions.
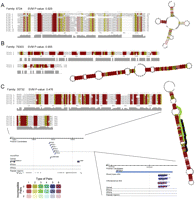
Selected candidate ncRNA families. SVM P-values and consensus structures are shown for each family. (A) A novel tRNA family including tRNATyr, tRNAPhe, and tRNA pseudogenes, with an intron inserted in the anticodon loop. (B) Novel box H/ACA snoRNAs. Element 79303.1 was experimentally confirmed in this study. (C) Novel isoforms of MIR1855. Element 35732.4 is predicted as a novel microRNA supported by 454 sequencing reads mapping on the mature region. (Black line along the hairpin structure) The mature MIR1855; (green line) the mature microRNA region of the 35732.4 element predicted in this study. Base pairs are colored by the RNAalifold program (Bernhart et al. 2008), using the following rules: Background colors indicate the number of different types of base pairs that support the structure from 1 (red) to 6 (purple). Pale backgrounds indicate that a base pair cannot be formed in some sequences of the alignment. Pairs in which one pairing partner is encircled exhibit consistent mutations, whereas pairs supported by compensatory mutations have both bases marked. Pairs that cannot be formed by some of the sequences are gray instead of black.
Six candidate ncRNA families correspond to experimentally confirmed box H/ACA snoRNAs (Supplemental Fig. S3), two of which are detected as homologs of RFAM families snoR5a and snoR80, while the other four are novel families. Figure 6B shows family 79303, a novel canonical box H/ACA snoRNA family that we predict to guide the pseudouridylation of U2247 in the large subunit rRNA.
Figure 6C shows members of candidate ncRNA family 35732, all of which can fold into a common miRNA precursor-like structure. Element 35732.3 is annotated as a precursor of MIR1855 in MirBase (Griffiths-Jones et al. 2008). Element 35732.4 is supported by rna-seq reads from shoot apex and inflorescence, mapping into the stem region (green line along hairpin) and delineating a mature miRNA that differs from the mature MIR1855 (black line). Again, we did not include this ncRNA in our training set, and yet our protocol was able to identify it as well as several related members. Furthermore, we note that MIR1855, which was discovered by deep sequencing (Zhu et al. 2008), has no homolog in mirBase. Therefore we couldn't have discovered this RNA family using classical comparative genomics.
Among our 3919 ncRNA repeat families, 2230 (56.0%) are involved in 2102 physical clusters, which means that they are physically located in the same intron or UTR, or separated by <1000 nt in an intergenic region. Of all physical clusters, 813 are intronic. Figure 7A shows an intronic cluster containing nine sequences from four different families. Most of the candidates here aren't conserved in maize, but one (78701.1) is found conserved in Brachypodium, a wild grass that is more closely related to rice than maize. Other, non-clustered locations are also of interest. Figure 7B shows two repeats from the same family mapping to two different loci, each supported by independent, noncoding full-length cDNA. Figure 7C shows another two-member family of which each member lies in an intron from a distinct gene.
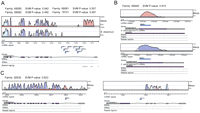
Selected novel ncRNA candidates shown with supporting evidence. In each case, we show, from top to bottom, repeat families and SVM P-values; VISTA conservation tracks for maize and/or Brachypodium; genomics locations of candidate ncRNA repeats (noted “ncRNA repeats”); gene structure and orientation; and annotation tracks for tRNA, rRNA, and repeat regions. VISTA colors coding for regions of high conservation are as follows: exons (dark blue); UTRs (light blue); noncoding (pink). (A) This large intronic cluster contains four different repeat families, with candidate 78701.1 conserved in Brachypodium distachyon. (B) A family whose members are supported by two pieces of evidence: a full-length cDNA (noted FL-cDNA) annotated as non-protein-coding and a conservation in maize. (C) A family whose two members lie in the introns of two different genes. Candidate 92932.1 is conserved in maize.
DISCUSSION
Genome-wide and local duplications have caused a proliferation of both protein-coding and ncRNA genes in plants. Here, we have developed a protocol that detects the presence of duplicated ncRNA genes based on their sequence footprint. From an initial set of more than 31 million repeats in the rice genome, we used a clustering protocol that identified 123,000 repeat families, and we isolated 3900 families harboring ncRNA features with an expected false discovery rate of 17%. This intragenome comparison pipeline is able to retrieve a significant fraction of the ncRNA complement of a plant genome in the absence of a second related genome for comparison. Our SVM ncRNA classifier does use some experimental data (rna-seq). However, it should be noted that most genome projects are now paired with an affordable run of high-throughput RNA sequencing for transcriptome assessment.
As many as 89% of the predicted ncRNA repeats do not have a detectable homolog in maize, indicating that most ncRNAs detected by our intragenome comparison protocol are rice-specific or, at least, specific to closer relatives such as Brachypodium. Our results suggest that the current ncRNA annotation of plant genomes, which is still based in a large part on comparative genomics, may miss several thousand ncRNA families that appeared more recently than the divergence time from species used for comparison. The fact that 80% of the ncRNA families detected in our intragenome screen are associated to tandem rather than segmental duplications further supports a recent occurrence of many ncRNA repeats, as there are more recent events of tandem duplications than of segmental duplications (Cannon et al. 2004).
Quite surprisingly, the recall ratio obtained by our repeat analysis for known multicopy ncRNAs such as miRNAs and snoRNAs is similar to that obtained by comparing the rice genome to the maize genome. This result illustrates the prevalence of ncRNA invention through duplication in plants. Consistently, we found that the fraction of known RNA genes that belong to multicopy families is significantly higher in rice than in human or other animals. More than half of the candidate ncRNA repeats are physically clustered, and candidates are generally over-represented in introns and UTRs, which is consistent with a transcribed status. Overall, putative ncRNA families represent <3% of the total 123,000 rice repeats that we identified. This may seem a small fraction, but their absolute number (3979) is quite large when compared to the number of novel miRNA and snoRNA families we expect to find in this set, which do not exceed 100–200. Then what could be the function of those multiple ncRNA repeats, of which we estimate 59% form significant secondary structures? Due to their presence in multiple copies, functional clues will hardly come from classical genetics. However, we expect that the build-up of rice rna-seq data from multiple tissues and conditions may soon provide us with expression patterns for many of these intriguing loci.
MATERIALS AND METHODS
Identification of repeat families
The genomic sequences and annotations of Oryza sativa ssp. japonica (IRGSP build 3) were downloaded from the Rice Annotation Project Database (http://rapdb.dna.affrc.go.jp/; Tanaka et al. 2008). The computational procedure is outlined in Figure 1. We initially masked all repeats predicted by RepeatMasker (Smit et al. 1996-2010) and all regions marked as “CDS” in the annotation files, which split the whole genome into a large list of segments. We
performed an “all against all” BLAST (Altschul et al. 1997) with parameter e = 0.01 for a similarity search inside or between segments. To improve detection of tandem regions within segments, we also
used the pairwise alignment program PALS (Edgar and Myers 2005), which has a special option to align a sequence onto itself (parameters -length 20 -pctid 86.0). Local alignments produced
by BLAST and PALS were retained only when meeting the following criteria: length of matched regions ≥19 nt, alignment score
≥17, and length of aligned region ≤200 nt. The reason for the 200-nt limit on repeat size, which accommodates most RNA families,
is that the subsequent clustering procedure considers only elements conserved in all members of a repeat family. In case a
long repeat contains several small RNAs, the complete repeat family may be discarded. All regions meeting those criteria were
mapped back to the genome. For each genomic position, we counted the number of times this position was mapped, which generated
a genome-wide frequency map. In each region separated by runs of 1 or more positions with zero frequency, we extracted the
high-frequency area with at least 19 contiguous nucleotides of frequency higher than in surrounding areas. High-frequency
regions were clustered into families according to the connectivity among aligned hits, as shown in Figure 1B. We used the Muscle program (Edgar 2004) to perform multiple alignment of sequences in each family, and we computed the conservation score π of each aligned position
using a 15-nt window, as follows: where n is the number of members in a family; L is the size of the window and equals 15; and Cij is the number of identical nucleotides between sequences i and j in the window.
We extracted the largest region with π ≥ 0.7 in each family and defined it as the final repeat family region.
In order to identify large duplication blocks, we performed inter- and intra- chromosomal alignments using the megaBlast program with default setting. Regions of alignments were then mapped back to the genome to define the boundaries of large duplication blocks.
Cloning and sequencing of rice box H/ACA snoRNAs
We isolated total cellular RNA from fresh rice sprouts (Oryza sativa L. ssp. indica) by guanidine thiocyanate/phenol ± chloroform extraction, and the cDNA library was constructed as described previously (Chen et al. 2003). Briefly, 20 μg of total RNA was tailed with ATP using poly(A) polymerase (Takara). The first strand of cDNA was synthesized with 5 μg of poly(A)+-tailed nuclear RNA in a 20-μL reaction mix containing 10 ng of primer ACAdT16 (5′-TTTTTTTTTTTTTTTTNNNTGT-3′) and 200 U of MMLV reverse transcriptase (Promega). The reaction products were subsequently fractionated on a denaturing 8% polyacrylamide gel, and cDNAs ranging in size from ∼70 to ∼300 nt were excised from the gel, passively eluted, and ethanol-precipitated. The cDNAs were then tailed with poly(dG) at the 3′ end by terminal deoxynucleotidyl transferase (Takara) and amplified by PCR using Ex Taq (Takara) with primers P1 and P2 (dT23-HindIII: 5′-CCCCAAAAGCTTTTTTTTTTTTTTTTTTTTTTT-3′; polyC-BamHI: 5′-GGAATTCGGATCCCCCCCCCCCCCCCC-3′). After cleavage by BamHI and Hind III, the cDNAs were purified and cloned into plasmid pTZ19. The recombinant plasmid carrying fragments were sequenced with the BigDye terminator cycle sequencing kit (PE Applied Biosystems) and universal primer P47. This protocol identified 28 H/ACA snoRNAs listed in Supplemental File 1. Manual inspection of surrounding genome regions identified 12 additional H/ACA snoRNAs (Supplemental File 1).
Prediction of box C/D snoRNAs
To identify box C/D snoRNAs in repeat families, we applied the snoScan (Lowe and Eddy 1999) and CDseeker (Yang et al. 2006) programs to search the ±100-nt region around each member in families. We used all positions of rRNA (25S, 16S, 5.8S) and snRNA (U1, U2, U4, U5, U6) sequences as potential guiding targets in both programs. For snoScan parameters, we specified the D box as CTGA, a max size of snoRNA candidates of 130 nt, and a perfect target match of at least 9 nt. The results from the two programs were processed separately using similar filtering steps. We only kept the highest scoring candidate for each family member. Candidates overlapping with CDS regions were discarded, as well as candidates with a ≥20-nt continuous region masked as low complexity by the Dust program (Morgulis et al. 2006). Based on this analysis, any repeat family satisfying the following conditions was considered as a box C/D snoRNA family:
-
At least half of the family members are predicted as snoRNAs and the minimum number of snoRNA candidates is 2 (one exception is that, in CDseeker results, snoRNA candidates with two functional regions upstream of boxes D and D′ are counted as two snoRNAs).
-
Identity among aligned snoRNA candidate sequences in the family is higher than 0.5 and lower than 0.98.
-
Less than half of the snoRNA candidates overlap UTR regions.
-
The maximum size of the largest duplication block that the repeat family members lie in is 1100 nt (for the reason that all known rice snoRNAs lie in <1100-nt duplication blocks).
-
For snoScan results, the mean snoRNA score of all members is ≥10.
Prediction of box H/ACA snoRNAs
We extracted the ±120-nt region around each repeat family member to scan for box H/ACA snoRNAs using both the snoGPS (Schattner et al. 2004) and ACAseeker (Yang et al. 2006) programs. The potential pseudouridylation sites of rice rRNAs and snRNAs were inferred from known Arabidopsis, human, and mouse sites based on the evolutionary conservation. These pseudouridylation sites were fed to the two programs as the potential target sites of box H/ACA snoRNAs. We sorted the snoGPS results based on the prediction score and only kept the 10 highest scoring candidates for each target site. For results from both programs, we only kept the highest scoring candidate in each family member that did not overlap a CDS region and was not masked by the Dust program. For a family to be considered as a box H/ACA, we required the following:
-
At least half of the members in the family are predicted as snoRNAs, and the minimum number of snoRNA candidates is 2 (one exception is that, in ACAseeker results, snoRNA candidates with two functional regions in the internal bulges of both 5′ and 3′ hairpins are counted as two snoRNAs).
-
Identity among aligned snoRNA candidate sequences in the family is higher than 0.6 and lower than 0.95.
-
Less than half of the snoRNA candidates overlap UTR regions.
-
The maximum size of the largest duplication block that the repeat family members lie in is 1100 nt.
-
For snoGPS results, the mean snoRNA score of all members is >34.
Prediction of microRNAs
For each repeat family, we extracted the ±200-nt regions around each family member and used the RNAfold program (Hofacker et al. 1994) to predict the secondary structures of sequences from both strands. For mature miRNA prediction, we extended the conserved
regions of each family member by 5 nt on each side and re-aligned the extended sequences using the Muscle program. These alignments
were scanned for potential mature miRNAs using a 21-nt window by 1-nt steps, as follows. The mature miRNA must have more than
13 fully conserved nucleotides in the alignment. Potential mature miRNAs should rest in one arm of a hairpin and form more
than 14 bp with the corresponding star miRNA whose length was restricted to the 19–24-nt range. Putative precursor miRNAs
were delimited based on the boundaries of the mature and star miRNAs with a 10-nt elongation on each side. To control the
stability of precursor hairpins, we again folded the precursor sequence using RNAfold and repeated the above filtering procedure.
Finally, we computed a miRNA score for each precursor and summed up all the scores to get an overall miRNA score for each
family, as follows: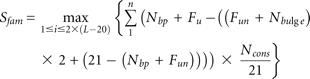 where i is the ordinal of the window; n is the number of members in a family. In window i, for each member, Nbp is the number of nucleotides involving in base-pairing; FU equals 1 if the first nucleotide is U, 0 otherwise; Fun equals 1 if the first nucleotide is unpaired, 0 otherwise; Nbulge is the number of bulges with more than two unpaired nucleotides; and Ncons is the number of fully conserved nucleotides.
To each sliding window there corresponds a microRNA score for the family. We defined the window with the highest microRNA score as the potential mature microRNA.
We calculated the P-value of each precursor by randomly shuffling the precursor sequence 999 times using randfold (Bonnet et al. 2004). Precursors with a P-value larger than 0.05 or overlapping with a CDS region were discarded. Finally, we only accepted microRNA families that had a mean family score larger than 15 and passed conditions 3 and 4 from the box C/D snoRNA section.
SVM for ncRNA detection in repeat families
To build a positive set of trusted ncRNAs in repeat regions, we used the Erpin program (Gautheret and Lambert 2001) to search the ±100-nt region around each repeat family member for homologs to known noncoding RNAs in the Rfam 9.1 database (Gardner et al. 2009). We only retained hits with an E-value below 1e-3. Repeat families containing two or more hits were categorized as positive. We obtained 140 positive families overall (trusted ncRNAs). A set of negative families was built from low-complexity regions and non-RNA repeats. A repeat family was classified as low complexity when any single nucleotide frequency was below 0.1 or above 0.5, and any di-nucleotide frequency was below 0.2 or above 0.8. A repeat family was classified as a non-RNA repeat when at least half of its members were predicted as repeats by RepeatMasker (Smit et al. 1996-2010) when screening the ±100-nt regions using the TIGR_Oryza_Repeats.v3.3 database (Ouyang et al. 2007). These criteria selected 35,725 negative families. Actual ncRNA searches were performed on the “non-negative” subset, which includes all families not in the negative set.
We used the LIBSVM program (Chang and Lin 2001) to generate the noncoding element classifier. We trained our model on a randomly selected subset of 70 positive families and 3500 negative families with a radial basis function (RBF) kernel using the 15 features listed in Table 3. Due to the size disequilibrium between negative and positive data sets, we set different weights for classes based on the size ratio of the negative and positive data sets with parameter -w1 1 -w0 50 to improve performance. The model was then run on the remaining positive and negative data sets to compute specificity and sensitivity values for the ROC curve. We performed 10 bootstraps and calculated the mean P-value for each family. Log-normalized SVM scores (Fig. 4) were computed as 1 + log(P).
For F-score calculation (Chen and Lin 2005), we used the total 140 positive family and 7000 randomly selected negative families. We performed 10 random selections of
negative families and computed a mean F-score as follows: where
where  ,
,  ,
,  are the average of the i-th feature of the whole, positive, and negative data sets, respectively; and
  and
and  are the i-th feature of the k-th positive and negative instance, respectively.
RNAz estimation of repeat alignments
We extended each sequence in repeat families by ±100 nt and re-aligned the sequences using the Muscle program (Edgar 2004). We ran RNAz 1.0 (Washietl et al. 2005b) with a scanning window of 150 nt and a step of 40 nt. When families had more than six members, we selected as RNAz input a subset of six sequences optimized to a mean pairwise identity of 70%. We ran RNAz in both forward and reverse strands. For each strand, the maximum P-value was assigned as the family's RNAz P-value.
Deep sequencing expression levels
We obtained rice MPSS deep sequencing data from Nobuta et al. (2007), which included signatures from both mRNAs (12 untreated tissues and six treated tissues) and small RNAs (three untreated tissues). We mapped all signatures to the rice genome using the Zoom program (Lin et al. 2008). Only signatures with one or more perfect matches were accepted. For each signature, we computed a mean expression score by dividing the sum of normalized values in all tissues by the total number of tissues and by the number of matches in the genome. We calculated the expression score of each repeat family member by summing up the mean scores of signatures lying in the ±100-nt region that did not overlap CDS regions. The expression score of a repeat family equals the total score of its members.
Microarray-based expression levels
We used the tiling microarray data from Li et al. (2006) generated by a minimal tiling strategy using 36-mer oligonucleotides representing the nonrepetitive sequences of the rice indica genome (August 2003 assembly, BGI) (Zhao et al. 2004). We extracted the ±60-nt region around each repeat family member according to its location in the japonica genome and used the Megablast program with default setting to align the extended sequence to the indica genome. For each member, we kept the best BLAST result that contains the full non-extended member region with an identity higher than 90% and that was not assigned to other members. The BLAST result was trimmed based on the position of repeat family members in the alignment. Repeat family members then had corresponding locations in the japonica genome. We calculated the expression score of a repeat family by adding the median values of probes in the ±100-nt region of each member in the japonica genome that did not overlap with a CDS region.
Conservation of repeat families
We obtained rice–Arabidopsis (Oryza sativa v.5.0 vs. Arabidopsis thaliana Mar. 2004) and rice–maize conserved regions (Oryza sativa v.5.0 vs. Arabidopsis thaliana Mar. 2004) from the VISTA genome browser (Frazer et al. 2004). We performed a BLAST search of all repeat family sequences against the TIGR Oryza sativa ssp. Japonica release 5 genome (Ouyang et al. 2007). Only sequences with complete matches were retained. Families that mapped on the TIGR genome were checked for conservation.
SUPPLEMENTAL MATERIAL
Supplemental material is available for this article.
ACKNOWLEDGMENTS
This research is supported by the key project of the National Natural Science Foundation of China (No. U0631001, 30830066), funds from Guangdong Province (2009A020102001), China, and by Centre National de la Recherche Scientifique, France. C.-J.C. was supported by a studentship from the China Scholarship Council and the Excellent Doctor Thesis program of Sun Yat-Sen University. The funders had no role in study design, data collection and analysis, decision to publish, or preparation of the manuscript. We thank Jian-Hua Yang for valuable comments on the manuscript.
Footnotes
-
Reprint requests to: Daniel Gautheret, Institut de Génétique et Microbiologie, CNRS/UMR 8621, Université Paris Sud, bâtiment 400, 91405 Orsay Cedex, France; e-mail: daniel.gautheret{at}u-psud.fr; fax: 33-1-69 15 46 29; or Liang-Hu Qu, Key Laboratory of Gene Engineering of the Ministry of Education, State Key Laboratory for Biocontrol, Sun Yat-sen University, Guangzhou 510275, PR China; e-mail: lssqlh{at}mail.sysu.edu.cn.
-
Article published online ahead of print.Article and publication date are at http://www.rnajournal.org/cgi/doi/10.1261/rna.2426511.
- Received August 20, 2010.
- Accepted November 18, 2010.
- Copyright © 2011 RNA Society




