


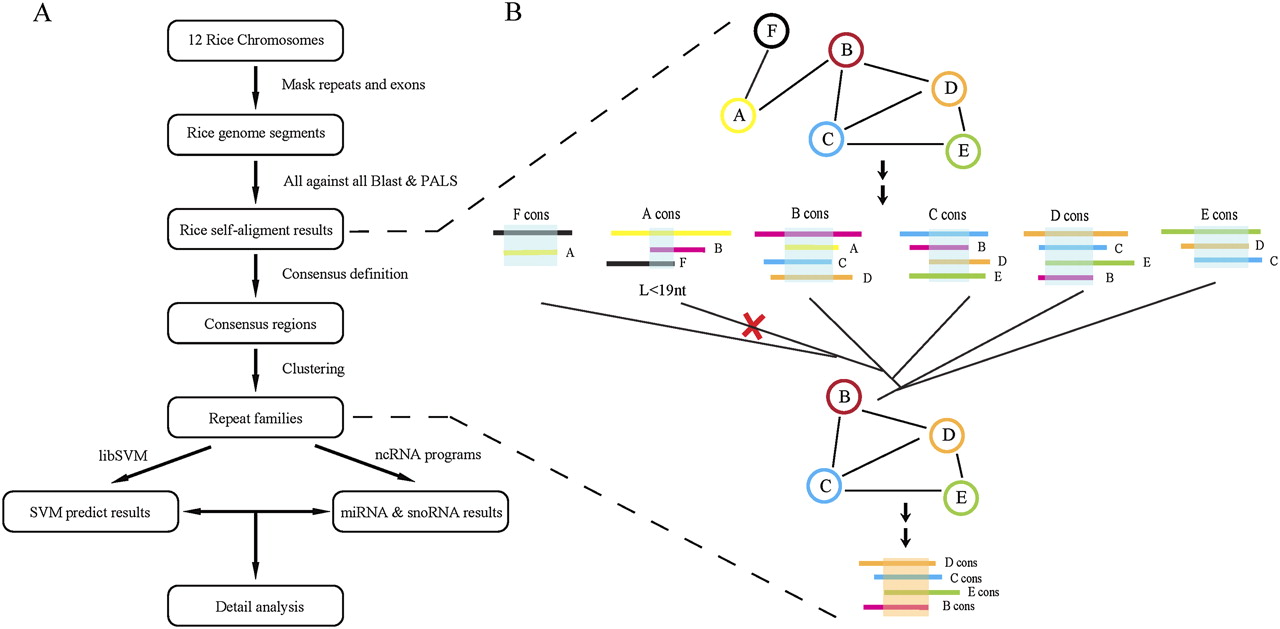
FIGURE 1.
Strategy for the identification of repeated noncoding RNA families in rice. (A) General flow diagram. (B) Illustration of the consensus building and clustering algorithm. Different genomic regions are shown with different colors. Shadows in aligned regions represent conserved elements, noted “A cons,” “B cons,” and so on. Graphs show genomic regions as vertices (circled) and possible alignments as edges.




