


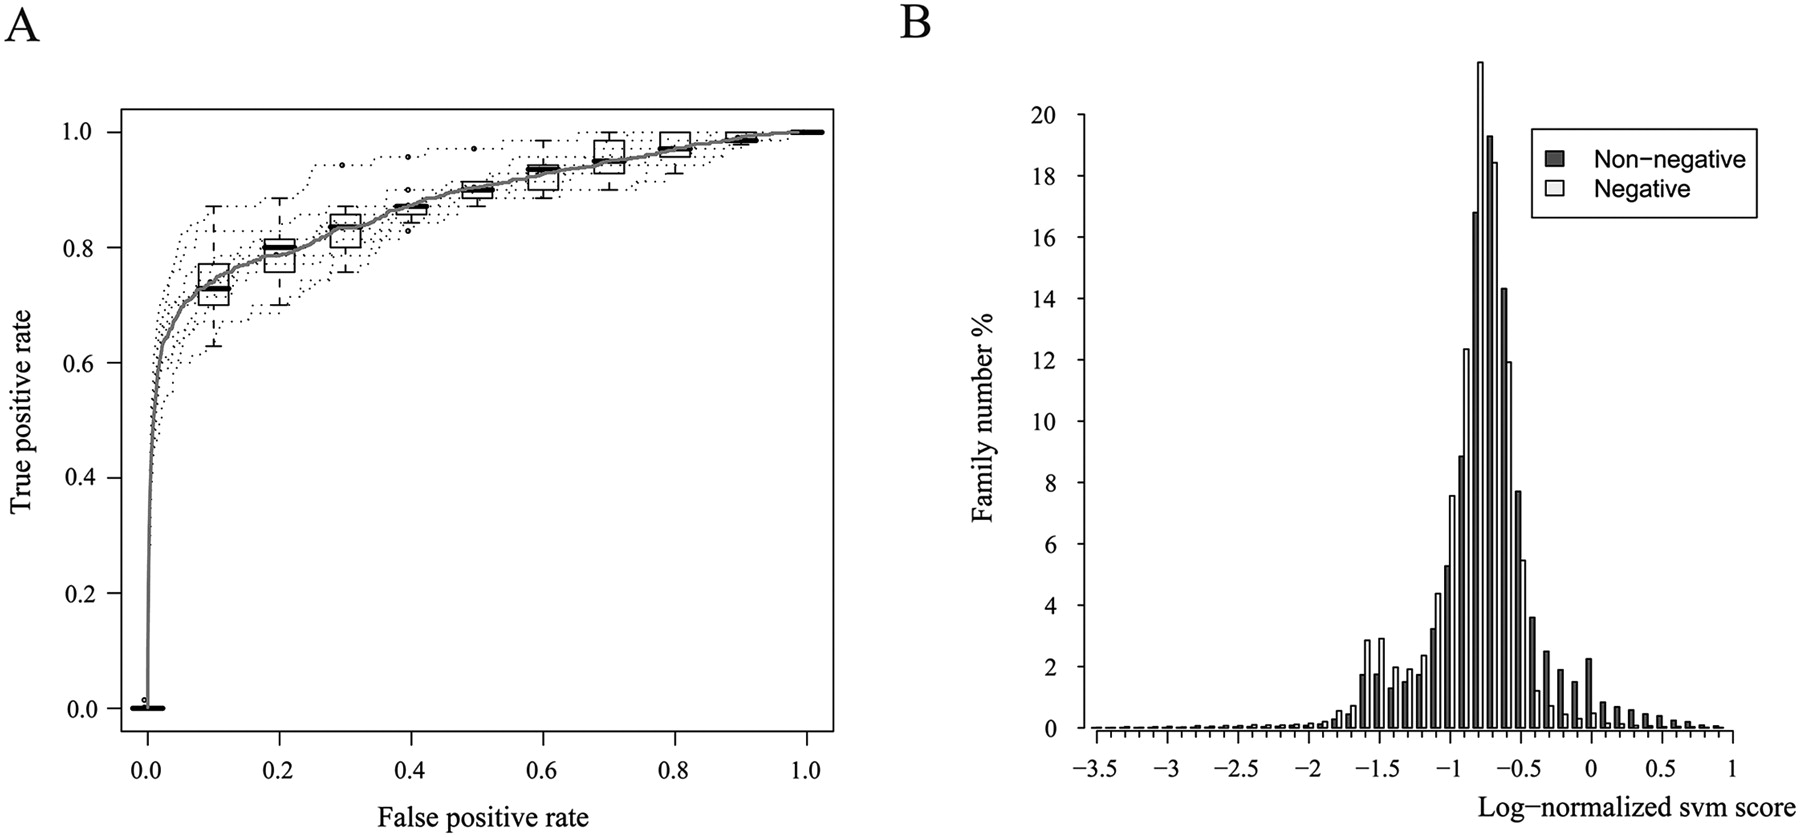
FIGURE 4.
SVM-based ncRNA family predictions. (A) ROC curves from 10 SVM training bootstraps and average ROC curve. The bootstrap curves are shown dotted/gray, while the average curve is shown solid/red. Boxplots show vertical spreads around the average. (B) Distribution of repeat families based on log-normalized SVM score, for non-negative families and negative families. For each family, the score is averaged over 10 predictions using SVM models from the 10 bootstraps in A.




