


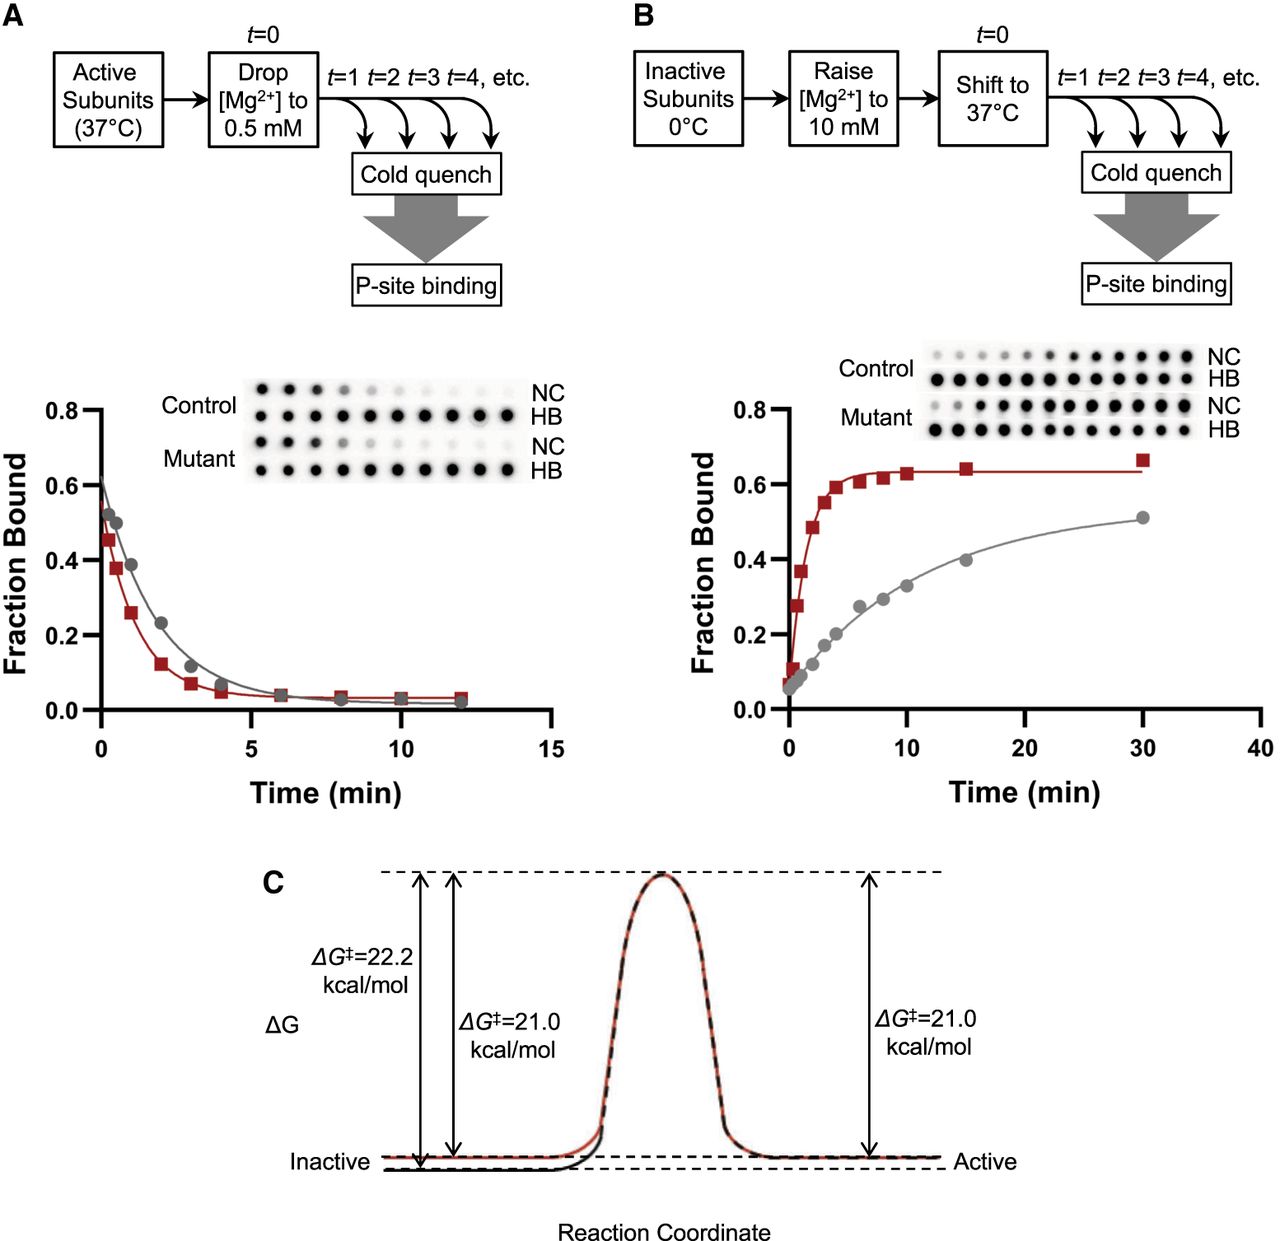
FIGURE 4.
Disruption of hALT destabilizes the inactive state in vitro. (A,B) Comparing the rate of inactivation (A) or activation (B) of wild-type (gray circles) and mutant (red squares) 30S subunits. Reaction schemes (top) and representative primary data (inset) are shown. (NC) Nitrocellulose, (HB) Hybond-N+. Each plot shows fitted data for one replicate. Three independent replicates were performed, yielding the following rates (mean ± SEM): WT inactivation, 0.57 ± 0.13 min−1; mutant inactivation, 0.65 ± 0.10 min−1; WT activation, 0.09 ± 0.01 min−1; mutant activation, 0.59 ± 0.05 min−1. (C) Free energy diagram depicting inactive-to-active conversion for control (black) and mutant (red) subunits.




