


High-throughput quantitation of protein–RNA UV-crosslinking efficiencies as a predictive tool for high-confidence identification of RNA-binding proteins
- Corresponding author: christopher.nicchitta{at}duke.edu
-
Handling editor: Peter Stadler
Abstract
UV-crosslinking has proven to be an invaluable tool for the identification of RNA–protein interactomes. The paucity of methods for distinguishing background from bona fide RNA–protein interactions, however, makes attribution of RNA-binding function on UV-crosslinking alone challenging. To address this need, we previously reported an RNA-binding protein (RBP) confidence scoring metric (RCS), incorporating both signal-to-noise (S:N) and protein abundance determinations to distinguish high- and low-confidence candidate RBPs. Although RCS has utility, we sought a direct metric for quantification and comparative evaluation of protein–RNA interactions. Here we propose the use of protein-specific UV-crosslinking efficiency (%CL), representing the molar fraction of a protein that is crosslinked to RNA, for functional evaluation of candidate RBPs. Application to the HeLa RNA interactome yielded %CL values for 1097 proteins. Remarkably, %CL values span over five orders of magnitude. For the HeLa RNA interactome, %CL values comprise a range from high efficiency, high specificity interactions, e.g., the Elav protein HuR and the Pumilio homolog Pum2, with %CL values of 45.9 and 24.2, respectively, to very low efficiency and specificity interactions, for example, the metabolic enzymes glyceraldehyde-3-phosphate dehydrogenase, fructose-bisphosphate aldolase, and alpha-enolase, with %CL values of 0.0016, 0.006, and 0.008, respectively. We further extend the utility of %CL through prediction of protein domains and classes with known RNA-binding functions, thus establishing it as a useful metric for RNA interactome analysis. We anticipate that this approach will benefit efforts to establish functional RNA interactomes and support the development of more predictive computational approaches for RBP identification.
Keywords
INTRODUCTION
With RNA-binding proteins (RBPs) providing critical posttranscriptional regulatory input on all elements of RNA biology, there is a pressing need for the comprehensive identification and functional characterization of RNA interactomes (Gerstberger et al. 2014; Hentze et al. 2018). Over the past decade, numerous methods for RNA interactome identification have been developed (Ascano et al. 2013; McHugh et al. 2014; Marchese et al. 2016; Wheeler et al. 2018; Ramanathan et al. 2019; Nechay and Kleiner 2020; Van Nostrand et al. 2020; Smith et al. 2021; Vieira-Vieira and Selbach 2021). These methods, which use UV-crosslinking combined with enrichment of protein–RNA complexes, are generally categorized as “UV-based RNA-centric methods,” or “RNA-centric methods” (Van Ende et al. 2020; Esteban-Serna et al. 2023). Combined, UV-based RNA-centric methods have now identified over 6000 candidate RBPs in mouse and human cell lines (Perez-Perri et al. 2023). In contrast, early computational prediction methods based on protein domain and sequence homology analysis identified <700 candidate RBPs in humans and mice (Anantharaman et al. 2002; Cook et al. 2011; Gerstberger et al. 2014). The growing divergence between experimental and predictive approaches to RBP identification has prompted the development of new computational approaches which incorporate protein structural features of newly identified candidate RBPs into frequency-based predictive models (Livi et al. 2016; Miao and Westhof 2016; Sharan et al. 2017; Zhang and Liu 2017; Bressin et al. 2019). However, in the absence of quantitative metrics for distinguishing high-affinity/high specificity, low-affinity/transient, and nonspecific/background interactions, all of which are represented in crosslinking-derived interactomes, the utility of such computational approaches is constrained by the uncertainties that come with inclusion and equal weighting of proteins whose RNA-binding function is inferred on UV-crosslinking studies alone.
Recent efforts toward experimental validation of newly identified candidate RBPs highlight the challenges confronting the attribution of RNA-binding function solely on UV-crosslinking (Porter et al. 2021; Ray et al. 2023). In one study, Ray et al. developed an in vitro method, termed RNAcompete, to measure candidate RBP-dependent enrichment of RNA sequences from a broadly representative 6–10mer unstructured and stem–loop RNA pool (Ray et al. 2023). In their recent study, 492 unconventional RBPs (ucRBPs) comprising proteins lacking canonical RNA-binding domains were analyzed, >80% of which were previously identified as candidate RBPs by RNA-interactome capture (RIC) (Castello et al. 2012; Hentze et al. 2018). Of the 492 ucRBPs tested, 23 (<5%) demonstrated RNA sequence binding specificity, indicating, as the authors note, that proteins exhibiting random and/or nonspecific interactions with RNAs are significantly represented in current RNA interactome studies (Ray et al. 2023). In a separate approach, Porter et al. reported a UV-crosslinking immunoprecipitation (CLIP)-sequencing method (easyCLIP) which uses fluorescent RNA-ligation efficiencies and RNA-seq read frequencies to derive protein–RNA crosslinking efficiency metrics (Porter et al. 2021). The complementary methods used in this approach allow evaluation of both RNA-binding specificity and “crosslink rate” (i.e., UV-crosslinking efficiency as defined herein) representing the molar percentage of proteins that are UV-crosslinked to RNA. In agreement with the findings of Ray et al. (2023), candidate RBPs lacking canonical RBDs displayed discernibly lower sequence specificity in their interactions as well as markedly lower UV-crosslinking efficiency (Porter et al. 2021). In addition, this study revealed a correlation between RNA-binding specificities and UV-crosslinking efficiency where among the 47 proteins tested, those with clear sequence preferences displayed UV-crosslinking efficiencies >0.1% (Porter et al. 2021). An additional observation made by Ray et al. was that ucRBPs are generally of markedly higher abundance than canonical RBPs and thus stochastically more likely to be captured as nonspecific interactors (Ray et al. 2023). Together, these findings highlight the need for distinguishing biologically specific protein–RNA interactions from low-frequency, nonspecific interactions and demonstrate the value of UV-crosslinking efficiency metrics for distinguishing specific versus nonspecific RNA interactors. Both RNAcompete and easyCLIP are resource intensive, however, which limits their broad utility for evaluating the RNA-binding function of the many thousands of candidate RBPs identified by UV-based RNA-centric methods.
We recently developed a UV-based RNA-centric method termed Liquid-Emulsion-Assisted-Purification of RNA-Bound Protein (LEAP-RBP) for the selective recovery of RNA-bound protein and introduced quantitative signal-to-noise (S:N)-based metrics for distinguishing high- and low-confidence candidate RBPs (Kristofich and Nicchitta 2023). As a method for enrichment and subsequent identification of RNA interactomes, LEAP-RBP can be distinguished from existing methods by its very high specificity for crosslinked protein–RNA complexes. This specificity enables the extension of this approach to high-throughput proteome-wide determination of protein-specific UV-crosslinking efficiencies (%CL). Bioinformatic characterization of these data for shared protein sequence and domain features as well as higher-order protein functional classifications affirms the superior RNA-binding functionality of canonical RBPs containing established RNA-binding domains. Consistent with the studies noted above, we also identify a cohort of candidate RBPs distinguished by their high total abundance and very low UV-crosslinking efficiencies, for example, two to three orders of magnitude lower than established RBPs, and suggest that these derive from background, nonspecific UV-crosslinking events. Importantly, the combined application of LEAP-RBP and %CL determinations allows the identification of ucRBPs with protein–RNA crosslinking efficiencies consistent with functions in RNA biology. The findings reported here thus support a quantitative framework for proteomic and computational identification of canonical and noncanonical RBPs with likely roles in RNA biology.
RESULTS
Sources of experimental noise in UV-based RNA-centric methods
Although UV-based RNA-centric methods are commonly used in the study of RNA interactomes, relatively little is known regarding the contributions of nonspecific interactions to candidate RNA interactomes and how these contributions impact the assignment of RNA-binding functions. In a prior report, we investigated this question by the development of a S:N-based analytical approach (Kristofich and Nicchitta 2023). Through S:N-based quantitative comparisons, we sought to distinguish bona fide protein–RNA interactions from nonspecific interactions. As reported previously, S/N can be used as a protein-specific metric representing the ratio of RNA-bound (S) to unbound (N) counterparts. In this approach, proteins without RNA-bound counterparts (S = 0) are designated as background (B) (Fig. 1A; Kristofich and Nicchitta 2023). SDS-PAGE mobility assays provide a straightforward means to evaluate RBP S/N in isolated ribonucleoprotein (RNP) fractions, where the RNase-dependent increase in the amount of protein migrating to the expected molecular weight of the unbound counterpart provides a measure of S/N (Fig. 1B; Kristofich and Nicchitta 2023). In principle, a discernible RNase-dependent mobility shift to the expected weight of the unbound protein is only expected for proteins that are bound to sizable RNA substrates via UV-crosslinking (Asencio et al. 2018; Urdaneta et al. 2019; Villanueva et al. 2020). However, the ability to accurately detect RNase-dependent SDS-PAGE mobility shifts is also sensitive to the amount of free protein recovered in the crosslinked RNP (clRNP) fraction. As a more quantitative approach to the analysis of experimental noise, S/N ratios can also be evaluated by mass spectrometry to determine RNA-bound (%TPS) and free protein (%TPN) abundances using an extension of the total protein approach (TPA) (Fig. 1C; Wiśniewski et al. 2012; Wiśniewski and Rakus 2014; Wiśniewski 2017). As illustrated in Figure 1D, cumulative %TPS and %TPN contributions represent the abundance of total RNA-bound and free protein in the sample. For optimal discrimination, methods that yield RNP fractions with high %TPS, reflecting a high specificity for protein–RNA adducts and consequently low relative noise, are necessary (Fig. 1D; Queiroz et al. 2019; Shchepachev et al. 2019; Trendel et al. 2019).
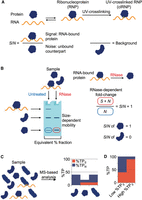
Schematic illustration of S:N-based protein–RNA interaction analysis. Graphics prepared in BioRender. (A) Graphical representation of protein-specific S/N analysis. RNA and protein interact to form an RNP complex; UV-irradiation stabilizes noncovalent RNA–protein interactors to form UV-clRNP. Protein-specific S/N ratios represent the ratio of RNA-bound to unbound counterparts. Background proteins do not contain RNA-bound counterparts. (B) Schematic illustration of SDS-PAGE RNase mobility shift assay (SRA) for determination of protein-specific S/N. The RNase-dependent increase in protein migrating at the expected weight of the unbound counterpart is linearly related to S/N: (|S| + N)RNase/(N)untreated = S/N + 1. (C) Schematic illustration of MS-based determination of RNA-bound and unbound (free) protein abundances by TPA. Stacked bar chart showing estimated RNA-bound (%TPS) and free protein (%TPN) contributions of three different proteins in the sample. (D) Stacked bar chart showing the difference in RNA-bound and free protein contributions of proteins in RNP fractions isolated by methods with low versus high specificity.
Different quantitative mass spectrometry approaches have been implemented to generate UV-enrichment ratios for diverse RNA interactomes (Fig. 2A). Because UV-crosslinking of proteins to RNAs (CL) increases the amount of RNA-complexed protein recovered from cells as compared to non-crosslinked cells (nCL), proteins displaying CL/nCL ratios significantly >1 by statistical hypothesis testing are generally considered as RBPs, given the assumptions that all proteins recovered in the RNP fraction of UV-crosslinked cells are RNA-bound and that recovery of free protein in the RNP fraction is UV-independent. However, SRA analysis of RNP fractions isolated from UV-crosslinked and non-crosslinked cell samples using multiple different UV-based RNA-centric methods revealed that UV-dependent recovery of free protein in RNP fractions is pervasive (Fig. 2B; Kristofich and Nicchitta 2023). In the absence of quantitative determinations of these experimental variables, it can thus be difficult to distinguish bona fide versus nonspecific protein–RNA crosslinking events.
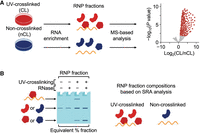
Schematic illustration of method-sensitive free protein recovery in RNA-centric RNA interactome screens. Graphics (A and B) prepared in BioRender. (A) Schematic illustration of non-SILAC LC–MS/MS comparison of RNP fractions isolated independently from UV-crosslinked or non-crosslinked cells by UV-based RNA-centric methods. Volcano plot showing significance values (P-values) of proteins identified in independent RNP fractions by LC–MS/MS as a function of their UV-enrichment ratios. (B) Graphical illustration depicting SRA analysis of RNP fractions (A) and their expected compositions. RNase-insensitive (free) protein exhibiting UV-dependent enrichment would appear as RNA-bound protein during non-SILAC LC–MS/MS comparisons.
Signal-to-noise-based determination of protein-specific UV-crosslinking efficiencies
To evaluate the contributions of experimental noise to candidate RNA interactomes and specifically to assignments of RNA-binding function, we previously proposed a ranking system referred to as RBP-confidence score (RCS), where RCS = log2(S/N) × log10(%TP). In this approach, protein UV-enrichment efficiencies are represented by log2(S/N) ratios, and protein abundances are expressed as a percentage of total MS intensity (log10[%TP]) (Wiśniewski et al. 2012; Wiśniewski and Rakus 2014; Wiśniewski 2017). Although RCS has utility for distinguishing bona fide from low-confidence candidate RBPs, it does not directly report UV-crosslinking efficiency, which is the key functional criterion in UV-crosslinking approaches. Importantly, the accurate assessment of protein–RNA crosslinking efficiencies requires the near 100% recovery of total protein, total RNA, and total clRNPs (or total RNA-bound protein), criteria met exclusively by the previously noted LEAP-RBP method (Fig. 3A,B; Supplemental Fig. S6; Kristofich and Nicchitta 2023). As summarized in Figure 3B, using the LEAP-RBP approach, RNA-bound protein abundance, (%TPS)clRNP, can be determined using S/N ratios and (%TP)clRNP; RNA-bound protein abundance in total protein (input) fractions, (%TPS)input, can be determined using protein UV-crosslinking efficiency (total RNA-bound protein yield/total protein yield) and (%TPS)clRNP; lastly, protein-specific UV-crosslinking efficiency can be calculated by dividing (%TPS)input by (%TP)input. Note that observed (O) protein abundance (%TPO) represents the combined contributions of both RNA-bound and unbound counterparts (e.g., %TPO = %TPS + %TPN = %TP). Protein-specific UV-crosslinking efficiency thus provides the molar percentage of a given protein that is UV-crosslinked to RNA (%TPS/%TPO)input (Wiśniewski et al. 2012; Wiśniewski and Rakus 2014; Wiśniewski 2017; Zhang and Liu 2017).
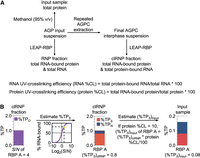
Quantitative determination of S:N-based RBP metrics. (A) Schematic illustration of the LEAP-RBP method, sample fractions, and fraction compositions. LEAP-RBP (RNP) fractions containing total RNA and total RNA-bound protein, or input (total protein) samples can be isolated from acidic guanidinium thiocyanate-phenol (AGP) input suspensions containing starting samples (e.g., cells or cell lysates) mixed with AGP. LEAP-RBP (clRNP) fractions isolated from final AGPC interphase samples contain total RNA-bound protein and/or protein-bound RNA. Efficient (near 100%) recovery of total protein, total RNA, and/or total RNA-bound protein allows accurate estimation of RNA and protein UV-crosslinking efficiencies. (B) Schematic illustration of S:N-based determination of protein-specific UV-crosslinking efficiencies by SILAC LC–MS/MS. From left to right: bar chart showing %TP contribution of hypothetical “RBP A” in clRNP fractions and corresponding S/N ratio of 4; line graph showing the estimated % of RBP A (yellow marker) that is RNA-bound based on its displayed S/N ratio of 4 (80% RNA-bound); stacked bar chart showing %TPS (RNA-bound) and %TPN (free) contributions of RBP A in clRNP fractions and stacked bar chart showing %TPS contributions of RBP A in input (total protein) samples based on protein UV-crosslinking efficiency of 10%. UV-crosslinking efficiency of RBP A = (%TPS)input/(%TPO)input × 100; and (%TPS)input = (%TPS)clRNP × protein yield of clRNP fraction/protein yield of the input sample.
To evaluate the utility of the approach summarized above in a high-throughput setting, we examined proteins detected in input samples (total protein) and LEAP-RBP fractions (total RNA-bound protein) by label-free LC–MS/MS. For the estimation of RNA-bound protein abundance (%TPS), we used previously reported S/N ratios determined by SILAC LC–MS/MS analysis of LEAP-RBP fractions (Kristofich and Nicchitta 2023). The abundance of proteins in input samples or LEAP-RBP fractions was calculated as a percentage of their respective total MS intensities, including proteins without estimated UV-crosslinking efficiencies. To emphasize quantitative accuracy, only proteins identified with at least two unique peptides were considered (see Materials and Methods). Using this approach, we determined UV-crosslinking efficiencies for 1097 proteins in HeLa cells (Supplemental Table S1). As illustrated in Figure 4A,B, protein-specific UV-crosslinking efficiencies positively correlate with protein abundance (%TP) and UV-enrichment efficiencies (S/N) in LEAP-RBP fractions, and negatively with protein abundance in input samples (Fig. 4C). This analysis revealed that protein-specific UV-crosslinking efficiencies can range over five orders of magnitude, with Elav-like family member CELF1, a bona fide RBP, displaying an estimated %CL of ∼56 and the glycolytic enzyme glyceraldehyde 3-phosphate dehydrogenase (GAPDH), a candidate noncanonical RBP, displaying an estimated %CL of ∼0.0017 (Supplemental Table S1). Importantly, while the ordinal ranking of candidate RBPs by UV-crosslinking efficiencies shows a strong positive correlation with their ordinal RCS ranking, the %CL metric provides a more robust assessment of RBP confidence, r(1062) = 0.75, P < 0.001 (Fig. 4D).
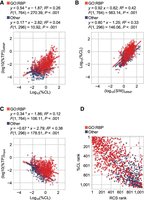
Protein-specific UV-crosslinking efficiency values predict protein abundance and UV-enrichment efficiency (S/N) in LEAP-RBP fractions. (A–D) Analytical summary: protein-specific UV-crosslinking efficiencies were estimated using protein abundances estimated by LC–MS/MS analysis of input (total protein) and LEAP-RBP (clRNP) fractions isolated from HeLa cells and protein S/N ratios estimated by SILAC LC–MS/MS analysis of LEAP-RBP (clRNP) fractions isolated from pooled samples containing UV-crosslinked and non-crosslinked HeLa cells (Kristofich and Nicchitta 2023). For additional information on samples, data analysis, and graphical representations, see Source Data and Methods. (A) Scatterplot showing observed abundances (log10[%TP]) of Gene-Ontology (GO)-annotated RBPs and other proteins lacking GO-annotated RNA-binding in LEAP-RBP (clRNP) fractions by LC–MS/MS as a function of their estimated UV-crosslinking efficiencies (log10[%CL]). (B) Scatterplot showing estimated UV-crosslinking efficiencies (log10[%CL]) of GO-annotated RBPs and other proteins as a function of their displayed log10(S/N) ratios in clRNP fractions by SILAC LC–MS/MS. (C) Scatterplot showing observed abundances (log10[%TP]) of GO-annotated RBPs and other proteins in input (total protein) samples by LC–MS/MS as a function of their estimated UV-crosslinking efficiencies (log10[%CL]). (D) Scatterplot showing a correlation between ordinal RCS rank and ordinal %CL rank of GO-annotated RBPs and other proteins.
To orthogonally validate this high-throughput %CL approach, we determined %CL of RBPs previously assayed by SRA and immunoblot, examining nucleolin (NCL), HuR, TIA1, RPL8, RPL4, PABPC4, pAbPC1, XRN1, LRRC59, TRAPα, and RPN1 (Kristofich and Nicchitta 2023), and determined %CL for an additional 14 candidate RBPs by SRA and immunoblot or LC–MS/MS: CELF1, HNRNPD, UPF1/RENT1, SND1, HDLBP, GEMIN5, fibrillarin (FBL), RPS3, eEF2, ABCF3, RanBP2, and PDIA3 (Fig. 5A). All the assayed proteins were identified as significantly UV-enriched in LEAP-RBP fractions by SILAC LC–MS/MS but differed in their enrichment efficiency (i.e., S/N) and abundance (%TP) (Kristofich and Nicchitta 2023). As a key test of the accuracy of this approach, ordinal ranking of protein targets using protein-specific UV-crosslinking efficiencies estimated by SRA and immunoblot or LC–MS/MS demonstrated a high positive correlation, r(23) = 0.97, P < 0.001 (Fig. 5B). As a further validation, we analyzed these data with respect to the 0.1% UV-crosslinking efficiency cutoff proposed by Porter et al. for distinguishing bona fide RBPs versus non-RBPs via the easyCLIP protocol (Porter et al. 2021). As shown in Figure 5A, all canonical RBPs and noncanonical RBPs detected by SRA and immunoblot displayed UV-crosslinking efficiencies >0.1% by LC–MS/MS, and candidate RBPs displaying UV-crosslinking efficiencies <0.1% by LC–MS/MS were undetectable by SRA and immunoblot. Furthermore, we observed a clear positive correlation between our analysis and that of Porter et al. despite cell-line differences (HeLa vs. HEK293T), F(1,17) = 5.86, P = 0.027 (Fig. 5C).
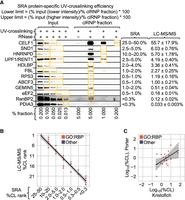
RNase/SDS-PAGE mobility assay-based validation of protein-specific UV-crosslinking efficiency estimated by LC–MS/MS. (A) Estimation of protein-specific UV-crosslinking efficiencies by comparing serial dilutions of RNase-treated input and clRNP fractions with SRA and immunoblot. Protein-specific UV-crosslinking efficiencies estimated by LC–MS/MS represent the mean ± 1 SD of n = 3 biologically independent replicates. Full blots for PDIA3, RanBP2, and HNRNPD are provided in Supplemental Figure S1. Full blots for other targets assayed herein were reported previously (Supplemental Fig. S1A; Kristofich and Nicchitta 2023). (B) Scatterplot showing a correlation between LC–MS/MS and SRA %CL rank of proteins assayed herein (A), or previously (Kristofich and Nicchitta 2023), color overlay based on GO-annotation (GO: RBP) status. (C) Scatterplot showing a correlation between protein-specific UV-crosslinking efficiencies estimated by LC–MS/MS and crosslink rates estimated by easyCLIP (Porter et al. 2021); color overlay based on GO-annotation (GO: RBP) status. For additional information on samples, data analysis, and graphical representations, see Source Data and Methods.
As with any crosslinking method, some level of nonspecific UV-crosslinking between RNAs and background proteins is expected (Porter et al. 2021; Ray et al. 2023). The observation that candidate RBPs lacking GO-annotated RNA-binding contribute <2% of the RNA-bound protein in LEAP-RBP fractions despite representing over 43% of UV-enriched proteins is illustrative of the magnitude of the noise/background contributions to current methods of RNA interactome study, where GO-annotated RBPs display higher UV-crosslinking efficiencies than proteins lacking GO-annotated RNA-binding, H(1) = 245.77, P < 0.001 (Fig. 6A). To explore this observation further, we first note that nonspecific crosslinking events are expected to be more readily detected for highly abundant proteins in total protein (input) fractions, as evidenced by their markedly lower UV-crosslinking efficiencies as compared to bona fide RBPs containing established RBDs. Proteins fulfilling these criteria include (highly abundant) adenine nucleotide-binding chaperones (n = 33), previously identified as candidate RBPs and whose primary role in nascent protein folding puts them in physical proximity to ribosome-engaged mRNAs, perhaps increasing the likelihood of low-frequency, nonspecific UV-crosslinking events (Zininga et al. 2018; Hagymasi et al. 2022). For comparison, established RNA-binders include ribosomal proteins (n = 105) and canonical RBPs containing one or more of the following RNA-binding domains: RNA-recognition motif (RRM, n = 121), DEAD/DEAH-box helicase domain (DEAD, n = 44), zinc-finger domain (zf, n = 32), K-homology domain (KH, n = 22), and double-stranded RNA-binding motif (DSRM, n = 10) (Lunde et al. 2007; Gerstberger et al. 2014). Note that some proteins contain more than one type of RBD and thus are included in multiple groups: 11 proteins containing RRMs also contain zf domains (n = 8) or KH domains (n = 3), and two proteins containing DEAD domains also contain either a KH or zf domain. Notably, most chaperone proteins displayed UV-crosslinking efficiencies <0.1%, orders of magnitude lower than RBPs with established RNA-binding activity (Fig. 6B). Curiously, UV-crosslinking efficiencies of ribosomal proteins were normally distributed, but their total abundances were bimodally distributed. It was determined that these differences were due to subcellular localization, with mitoribosomal proteins being less abundant than cytoribosomal proteins, yet they display comparable UV-crosslinking efficiencies (Fig. 6C). This observation further validates the %CL approach and suggests comparable RNA-occupancy and tight coordination of ribosomal and mitoribosomal protein and rRNA levels during ribosome biogenesis (Pecoraro et al. 2021; Petibon et al. 2021).
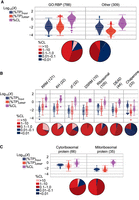
Canonical RBPs display high UV-crosslinking efficiencies. (A) Violin plots (equal area) with box plot and 95% confidence diamond overlays showing estimated UV-crosslinking efficiencies (purple) of GO-annotated RBPs (GO:0003723), proteins lacking GO-annotated RNA-binding, and their observed abundances (log10[%TP]) in input (blue) and clRNP (red) fractions. Corresponding pie charts show the proportion of proteins within each %CL bin. (B) Comparison (A) of ribosomal proteins (PC00202), chaperones (PC00072), and canonical RBPs containing at least one of the indicated RNA-binding domains (Pfam, see Source Data). (C) Comparison (A) of ribosomal proteins (B) containing additional GO-annotation as cytosol (GO:0005829) or mitochondrion (GO:0005739) cellular component. The resulting ribosomal protein lists were curated to correct for missing or false GO-annotation.
Efforts to profile RNA-bound proteomes with UV-based RNA-centric methods have led to the inclusion of many proteins with established roles in glycolysis, pyruvate metabolism, fatty-acid metabolism, and/or that express dehydrogenase enzymatic function (Castello et al. 2012, 2015; Beckmann et al. 2015; Hentze et al. 2018; Perez-Perri et al. 2018, 2023; Balcerak et al. 2019). While many of these proteins were also identified in LEAP-RBP fractions and thus are formally considered candidate RBPs, they displayed low UV-crosslinking efficiencies and are highly abundant in total protein (input) fractions, which is expected for background contributors (Fig. 7A). Included in this list and as a representative example is the glycolytic enzyme GAPDH which was undetectable in LEAP-RBP fractions by SRA and immunoblot, presumably because it displays a calculated %CL of ∼0.002%, beyond the resolution limits of the assay system (Supplemental Table S1). This observation highlights the efficiency of the LEAP-RBP method in capturing protein–RNA adducts, even in scenarios where the crosslinking efficiency is exceedingly low.
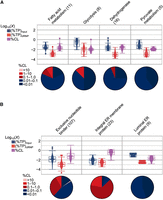
Protein-specific UV-crosslinking efficiencies reveal RNA-binding potential. (A) Violin plots (equal area) with box plot and 95% confidence diamond overlays showing estimated UV-crosslinking efficiencies (purple) of proteins containing the indicated classifications (Panther, see Source Data) and their observed abundances (log10[%TP]) in input (blue) and clRNP (red) fractions. Corresponding pie charts show the proportion of proteins within each %CL bin. (B) Comparison (A) of proteins containing GO-annotated nucleotide-binding (GO:0000166) but lacking GO-annotated RNA-binding (GO:0003723), endoplasmic reticulum (ER) membrane proteins (GO:0005789) and integral component of membrane (GO:0005677) GO-annotation, and proteins containing ER lumen (GO:0005788) but which lack ER membrane (GO:0005789) GO-annotation. The resulting protein lists were curated to correct for missing or false GO-annotations based on annotated (UniProt) protein features.
Notably, this analysis also revealed that there are many noncanonical RBPs which display appreciable UV-crosslinking efficiencies, including those which lack GO-annotated RNA-binding but which display RNase-sensitivity in LEAP-RBP by SRA and immunoblot. This list includes the ATP-binding cassette (ABC) subfamily F member 3 (ABCF3) and the integral ER membrane proteins LRRC59, TRAPα, and RPN1 (Fig. 7G,J; Kristofich and Nicchitta 2023). Of interest to studies of translational regulation on the ER, several integral ER membrane protein candidate RBPs display UV-crosslinking efficiencies >0.1% whereas ER proteins (e.g., the chaperone HSP90B1) resident to the lumen of the ER, and thus not expected to engage in meaningful interactions with RNAs, display very low but non-zero UV-crosslinking efficiencies (Fig. 7B). Also of interest, ABCF3 has been reported to bind 2′–5′-oligoadenylates (2-5A), RNAs which function as second messengers in mammalian innate immunity signaling via activation of RNaseL (Govande et al. 2023).
Protein-specific %CL metric-based identification of protein features predictive of RNA-binding
Current computational approaches for identifying protein features that engage in RNA-binding typically use frequency-based predictive models whose accuracy limits are constrained by training data sets that, as noted above, can include nonspecific interactors (Gerstberger et al. 2014; Miao and Westhof 2016; Sharan et al. 2017; Zhang and Liu 2017; Hentze et al. 2018; Bressin et al. 2019). Therefore, we tested whether protein-specific UV-crosslinking efficiency could serve as a complementary approach for the identification of protein features supporting RNA-binding function. Here we compiled a list of UniProt protein identifiers containing the most recent annotations for humans and mapped protein domains and repeats from the Pfam and InterPro databases (Supplemental Table S2). After filtering for those which mapped to three or more candidate RBPs with determined UV-crosslinking efficiencies (n = 1097), they were ranked according to frequency (i.e., prevalence) or average %CL. Spearman's rank correlation analysis indicated a weak positive correlation between frequency and %CL ranking of Pfam domains, r(109) = 0.20, P = 0.032, but did not reveal a significant correlation for Pfam repeats, r(13) = 0.04, P = 0.876, InterPro domains, r(185) = 0.11, P = 0.130, or InterPro repeats, r(14) = 0.10, P = 0.709. This finding indicates that ranking protein features by their prevalence among candidate RBPs does not facilitate the identification of features which are predictive of higher UV-crosslinking efficiency (Supplemental Fig. S2A–D). Indeed, when comparing the top and bottom 15 protein domains (InterPro) based on %CL, several domains with similar frequencies map to proteins exhibiting highly variable UV-crosslinking efficiencies (Fig. 8A). Notably, domains enriched in proteins with high %CL include the spen paralogue and orthologue (SPOC) domain, Pumilio (PUM) homology domain, and cold-shock domain (CSD). Conversely, domains enriched in proteins with low %CL include the clathrin/coatomer adaptor domain, protein disulfide-isomerase thioredoxin-like domain, and heat shock protein Hsp90 N-terminal adenine nucleotide-binding domain. Similar analysis of mapped Pfam protein domains gave comparable results (Fig. 9A). Indeed, proteins containing any of the top 15 domains from either analysis are considered established RBPs and include PUM proteins, RNA-binding motif (RBM) proteins, heterogeneous nuclear ribonucleoproteins (HNRNP), polypyrimidine tract-binding (PTBP) proteins, and CSD-containing proteins. Domains which exclusively map to proteins without canonical RNA-binding domains, such as the kinesin-like domain which maps to motor proteins KIF14, KIF1B, and KIF1C, do not appear until rank 33 (InterPro and Pfam). Curiously, however, KIF1C is UV-crosslinked nearly an order of magnitude more efficiently than KIF14 and KIF1B (9.30% vs. 0.91% and 1.31%, respectively), well within the upper quartile range of canonical RBPs (Fig. 6A). This finding supports a proposed model positioning KIF1C as a direct RNA-binder facilitating transport of mRNAs along microtubules (Pichon et al. 2021).
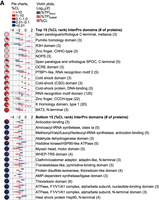
Top 15 and bottom 15%CL ranked InterPro domains mapped to three or more candidate RBPs with estimated UV-crosslinking efficiencies. (A) Violin plots (equal area) with box plot and 95% confidence diamond overlays showing estimated UV-crosslinking efficiencies (purple) of proteins containing the indicated InterPro domains and their observed abundances (log10[%TP]) in input (blue) and clRNP (red) fractions. Corresponding pie charts show the proportion of proteins within each %CL bin.
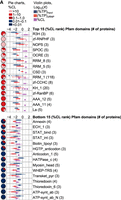
Top 15 and bottom 15%CL ranked Pfam domains mapped to three or more candidate RBPs with estimated UV-crosslinking efficiencies. (A) Violin plots (equal area) with box plot and 95% confidence diamond overlays showing estimated UV-crosslinking efficiencies (purple) of proteins containing the indicated Pfam domains and their observed abundances (log10[%TP]) in input (blue) and clRNP (red) fractions. Corresponding pie charts show the proportion of proteins within each %CL bin.
Repetitive protein elements are a common feature of RBPs (Gerstberger et al. 2014; Hentze et al. 2018). We identified 16 repeat domains on InterPro and 15 repeat units on Pfam which mapped to three or more candidate RBPs with calculated UV-crosslinking efficiencies. Repeat domains mapping to proteins with high %CL include the PUM RNA-binding repeat, tetra-/penta-tricopeptide (TPR) repeat, WD40 repeat, and leucine-rich repeat (LRR) (Fig. 10A). Conversely, repeat domains which mapped to proteins with low %CL include the HEAT repeat, annexin repeat, and armadillo repeat. PUM RNA-binding repeats are found in canonical RBPs (e.g., PUM proteins) with established roles in RNA biology. However, TPR, WD40, and LRRs are found in proteins lacking canonical RBDs, but which have proposed RNA-binding functions (Gerstberger et al. 2014; Hentze et al. 2018). This includes the integral ER membrane protein LRRC59 which contains five LRRs in its cytosol-facing N-terminal region and GEMIN5 which contains five interspersed WD40 repeats (Ichimura et al. 1992; Piñeiro et al. 2015; Francisco-Velilla et al. 2016; Hannigan et al. 2020). Consistent with these findings, we were able to validate direct in vivo RNA-binding of both noncanonical RBPs using LEAP-RBP and SRA. Because prior evidence for their direct RNA-binding was obtained from experiments performed in vitro and/or with recombinant proteins, these data provide additional orthogonal evidence in support of physiological relevant RNA-binding functions for these proteins. A full list of %CL ranked protein features including mapped protein IDs and associated descriptors/quantitative metrics are provided in Supplemental Table S3. Combined, these data and associated analyses support the use of protein-specific UV-crosslinking efficiencies in the development of predictive algorithms for RBP domains/feature identification.
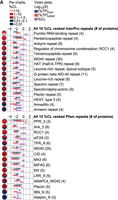
%CL ranked InterPro and Pfam repeats mapping to three or more candidate RBPs with estimated UV-crosslinking efficiencies. (A) Violin plots (equal area) with box plot and 95% confidence diamond overlays showing estimated UV-crosslinking efficiencies (purple) of proteins containing the indicated Pfam or InterPro repeats and their observed abundances (log10[%TP]) in input (blue) and clRNP (red) fractions. Corresponding pie charts show the proportion of proteins within each %CL bin.
Evaluating RNA-binding potential of lower and higher-order protein classes
Pfam and InterPro provide two different levels of protein classification based on sequence similarity (protein families) or structural and functional similarity (clans and/or superfamilies). As before, ranking protein classes by the average protein-specific UV-crosslinking efficiencies of their constituents is expected to be more informative than ranking by frequency or prevalence alone (Supplemental Fig. S2E–H). Nonetheless, only those proteins containing at least three candidate RBPs with an estimated %CL were included for the following analyses. Many of the top 15 protein families from Pfam and InterPro ranked by %CL contain proteins with similar configurations of high-ranking RNA-binding domains identified previously (Figs. 11A and 12A). This includes the HnRNP R/Q splicing factor family which contains three RRMs and variable C-terminal domains, the LA domain-containing protein family whose members contain the winged helix La and one RRM, or G-patch domain protein family whose members contain seven highly conserved glycine residues (G-patch) which may have RNA-binding functions (Lunde et al. 2007; Cook et al. 2011; Gerstberger et al. 2014). Conversely, lower-ranking protein families contain sequence similarities which may contribute to low-frequency, nonspecific UV-crosslinking. Included in this category are the adenine nucleotide-binding HSP90 chaperone family whose members perform protein-binding functions (Zininga et al. 2018; Hagymasi et al. 2022), the adenosine monophosphate (AMP)-binding protein family whose members function in fatty-acid metabolism (Nguyen et al. 2008; Ceddia 2013; Frühbeck et al. 2014), and the Aldedh protein family whose members express dehydrogenase activity (Eventoff and Rossmann 1975; Steinmetz et al. 1997). Ranking of protein superfamilies (InterPro) or clans (Pfam) which classify proteins based on structural and functional characteristics shows similar trends (Figs. 13A and 14A). Both levels of protein classification reduced the observed variability of protein UV-crosslinking efficiencies, with lower-order protein families showing the least (Supplemental Fig. S3A–D). This finding suggests that sequence similarities have a stronger influence on UV-crosslinking efficiency than structural and/or functional similarities (Bressin et al. 2019).
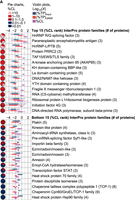
Top 15 and bottom 15%CL ranked InterPro families containing three or more candidate RBPs with estimated UV-crosslinking efficiencies. (A) Violin plots (equal area) with box plot and 95% confidence diamond overlays showing estimated UV-crosslinking efficiencies (purple) of proteins within each of the indicated InterPro families and their observed abundances (log10[%TP]) in input (blue) and clRNP (red) fractions. Corresponding pie charts show the proportion of proteins within each %CL bin.
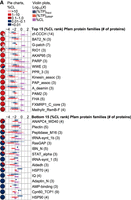
Top 15 and bottom 15%CL ranked Pfam families containing three or more candidate RBPs with estimated UV-crosslinking efficiencies. (A) Violin plots (equal area) with box plot and 95% confidence diamond overlays showing estimated UV-crosslinking efficiencies (purple) of proteins within each of the indicated Pfam families and their observed abundances (log10[%TP]) in input (blue) and clRNP (red) fractions. Corresponding pie charts show the proportion of proteins within each %CL bin.
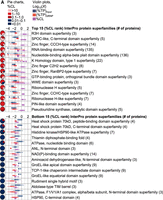
Top 15 and bottom 15%CL ranked InterPro homologous superfamilies containing three or more candidate RBPs with estimated UV-crosslinking efficiencies. (A) Violin plots (equal area) with box plot and 95% confidence diamond overlays showing estimated UV-crosslinking efficiencies (purple) of proteins within each of the indicated InterPro homologous superfamilies and their observed abundances (log10[%TP]) in input (blue) and clRNP (red) fractions. Corresponding pie charts show the proportion of proteins within each %CL bin.
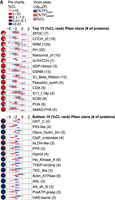
Top 15 and bottom 15%CL ranked Pfam clans containing three or more candidate RBPs with estimated UV-crosslinking efficiencies. (A) Violin plots (equal area) with box plot and 95% confidence diamond overlays showing estimated UV-crosslinking efficiencies (purple) of proteins within each of the indicated Pfam clans and their observed abundances (log10[%TP]) in input (blue) and clRNP (red) fractions. Corresponding pie charts show the proportion of proteins within each %CL bin.
DISCUSSION
Here we report the utility of protein-specific UV-crosslinking efficiency (%CL) as a quantitative metric for RNA interactome analysis and validation. With UV-crosslinking being the primary experimental approach to both RNA interactome discovery and the study of RBP–RNA interaction dynamics, %CL provides a quantitative assessment of relative occupancy—the fraction of a given RBP candidate that is in complex with RNA—and how cell state changes may invoke regulation of RBP–RNA interactions. We demonstrate how the LEAP-RBP method allows %CL studies to be readily performed on a proteome-wide basis. The substantial (e.g., five orders of magnitude) dynamic range in UV crosslinking efficiency detectable by this method provides considerable utility in the identification of bona fide RBPs and discrimination of low efficiency and likely nonspecific crosslinking events. Through integration with protein domain and RNA interaction motif databases, %CL also provides a useful quantitative metric for the continued evolution of computational and related AI approaches to RNA-binding prediction and RNA interaction site identification. A key finding from this study is the congruence with prior work where CLIP-seq methodologies were used to define an operational %CL value of 0.1% for distinguishing bona fide RBPs as well as studies examining RNA-binding specificities of ucRBPs, which report weak, nonselective interactions for numerous candidate RBPs identified by UV-based RNA-centric methods (Porter et al. 2021; Ray et al. 2023).
An overarching question from this analysis concerns the assignment of RNA-binding function to proteins with low UV-crosslinking efficiencies. In the case of candidate RBPs containing known RNA interaction motifs and represented by proteins of low to average abundance, %CL values are generally high and RNA-bound species can represent a substantial fraction (>40%) of a given protein. In general, such high bimolecular crosslinking efficiencies are unusual. Canonical RBPs, however, commonly contain multiple RNA-binding domains and/or assemble into homooligomeric complexes capable of multivalent interactions with RNAs (Cook et al. 2011; Corley et al. 2020; Stitzinger et al. 2023). Consequently, functional affinities (avidity) and protein–RNA interaction lifetimes can be quite high, enabling high protein–RNA crosslinking efficiencies (Mackereth and Sattler 2012; Corley et al. 2020; Stitzinger et al. 2023). In the case of low (e.g., <0.1%) %CL values, the assignment of RNA-binding function is far more challenging. It is certainly possible that intrinsic protein-specific biases in crosslinking efficiency could be responsible for low UV-crosslinking efficiencies despite biologically relevant RNA-occupancy (Wheeler et al. 2018; Vieira-Vieira and Selbach 2021). Arguing against this view is the finding that structurally diverse, established RBPs display substantially higher, quantitatively distinguishable UV-crosslinking efficiencies. Notably, this includes RBPs containing DSRM which display appreciable crosslinking efficiencies despite being considered poor crosslinking partners (Fig. 6B; Liu et al. 1996; Wheeler et al. 2018; Van Ende et al. 2020). Alternatively, low UV-crosslinking efficiencies may reflect scenarios where RNA-binding is restricted to an RBP population subset, perhaps distinguished by a posttranslational modification, a mRNA population subset, perhaps bearing a posttranscriptional modification, or functionally related translational regulatory processes (Kejiou et al. 2023). In these scenarios, the identification of specific RNA and/or functionally distinct RBP subsets as well as experimental demonstrations that protein–RNA interactions have a biological readout is critical to the validation of biologically relevant RNA-binding activity (Wheeler et al. 2018). While some of these proteins might be performing promiscuous, albeit physiologically relevant RNA-binding activities in the cell, it is plausible, if not more likely, that most represent false positives arising from low-affinity, nonspecific interactions with RNA (Porter et al. 2021; Ray et al. 2023). In the cases of low UV crosslinking efficiency, the identities of the RNA interactors may also be revealing. In the cases of the ABC transporter superfamily protein ABCF3 and the Drosophila protein Decr1, a metabolic enzyme functioning in β-oxidation and metabolism of unsaturated CoA esters, 2′–5′ oligoadenylates interact with the Walker A/B motif of the ABC cassette and the NADPH cofactor binding site of Decr1, respectively (Govande et al. 2023). The regulatory significance of these interactions and potential links to antiviral immunity remains, however, under investigation. As noted above, many low %CL candidate HeLa RBPs are either adenosine nucleotide- or NADH/NADPH-binding proteins and so it should be considered that weak, nonspecific RNA-binding interactions at these sites may contribute to their identification as RBPs in RNA-centric interactome studies.
From a practical standpoint, the authenticity of the many thousands of candidate RBPs identified by UV-based RNA-centric methods can be partially resolved by evaluating RNP fractions by orthogonal approaches such as RNase-sensitive mobility on SDS-PAGE. As noted, it has been repeatedly demonstrated that canonical RBPs are recovered in RNP fractions of RNA-centric UV-crosslinking studies and SRA analysis of RNP fractions isolated by LEAP-RBP and five of the most widely used RNA-centric RBP discovery methods demonstrate that these are true protein–RNA adducts (Fig. 8B,C; Kristofich and Nicchitta 2023). In addition, the possibility of nonspecific protein–protein crosslinking as a contributor to this phenomenon has been recently addressed by LC–MS/MS analysis of contiguous gel slices containing SDS-PAGE separated RIC fractions (Perez-Perri et al. 2023). In principle, proteins which are crosslinked to other proteins are not expected to migrate to the expected molecular weight of their unbound counterpart in RNase-treated fractions. Therefore, proteins which are bimodally distributed and display significant peak intensity at a higher molecular weight than their unbound counterparts may be nonspecifically crosslinked to other proteins. Curiously, many of the metabolic enzymes which we identified as having very low UV-crosslinking efficiency displayed bimodal peak intensities. This includes pyruvate kinase (PKM), alpha-enolase (ENO1), and GAPDH (Supplemental Fig. S5G; Perez-Perri et al. 2023). Furthermore, density plots of total MS-intensity contributions of all identified proteins showed significant contributions of low molecular weight proteins (<100 kDa) within high molecular weight (>150 kDa) gel slices (Supplemental Fig. S5D; Perez-Perri et al. 2023). This suggests UV-irradiation-driven protein–protein crosslinking is significant and can lead to UV-dependent recovery of non-RBPs.
The S:N-based analytical perspective emphasized in this study will likely be useful in the meta-analysis of the expanding RNA interactome. The analyses and conclusions made here were constrained to avoid overgeneralizing based on a single data set. Indeed, cell- and/or context-dependent differences in protein-specific UV-crosslinking efficiencies are expected to vary based on observed differences in RNA-bound abundances (Fig. 7I,J). Likewise, not all RBPs exhibit UV-dose-dependent increases in RNA-bound abundance (Supplemental Fig. S6; Kristofich and Nicchitta 2023). Necessarily, the impact of %CL ranking of candidate RBPs, protein features, and higher-order classifications requires further investigation. Furthermore, protein features and higher-order classifications which mapped to <3 candidate RBPs may be more predictive of RNA-binding potential (i.e., map to one or two proteins which display higher or lower average %CL) but were not included for data presentation purposes (Supplemental Table S3).
MATERIALS AND METHODS
Supplemental material
Supplemental Table S1 contains the complete list of proteins, estimated UV-crosslinking efficiencies, and referenced MS data sets. Supplemental Table S2 contains compiled lists of UniProt IDs (Human), Pfam annotations, and InterPro annotations. Supplemental Table S3 contains the complete list of Pfam and InterPro protein features and protein classes ranked by the average %CL of candidate RBPs. Supplemental Table S4 contains blocking and blotting conditions for WB targets used in this study. Supplemental Table S5 contains GO-annotated protein lists with assigned UniProt IDs used for this study.
Resource availability
Further information and requests for resources and reagents will be fulfilled by the lead contact.
Material availability
This study did not generate new unique reagents.
Gene-Ontology enrichment analysis
GO enrichment analyses were performed using PANTHER V17.0 (Thomas et al. 2003). For additional analyses of GO-annotated groups, lists were exported and assigned UniProt IDs as described in Supplemental Table S2. The resulting GO-annotated protein lists were used to sort protein IDs for downstream analyses and can be found in Supplemental Table S5.
Cell line and culture conditions
HeLa cells were maintained in Dulbecco's Modified Eagle's Medium (D6428, Sigma) supplemented with 10% FBS (35-010-CV, Corning) at 37°C, 5% CO2.
UV-crosslinking and cell harvesting
HeLa cells were cultured in 150 mm dishes until 60%–90% confluent, washed twice with ice-cold 1× PBS, and irradiated on ice with 400 mJ/cm2 at 254 nm. Cells were lysed on plate, scraped, and transferred to a 2 mL microcentrifuge tube using two 400 µL aliquots of guanidinium thiocyanate (GT) (−phenol) buffer. GT buffer (4 M GT, 25 mM sodium citrate pH 7.0, 0.5% N-lauryl sarcosine, 5 mM EDTA pH 8.0, and 0.1 M 2-mercaptoethanol) was prepared as described in Chomczynski and Sacchi (1987, 2006), with additional modifications described in Kristofich and Nicchitta (2023).
Isolation of input and clRNP fractions
Input samples containing total protein and clRNP fractions containing total RNA-bound protein were isolated as described in Kristofich and Nicchitta (2023) and suspended in 1% lithium dodecyl sulfate (LiDS) (J32816, Thermo) in TE. Sample suspensions were clarified before RNA and protein quantitation: incubated at 55°C for 20 sec, mixed by brief vortex, centrifuged at 3000g for 20 sec at 20°C, and clarified supernatants (∼90% v/v) were transferred to a new tube.
RNA and protein quantitation
Samples containing more than 1.5 µg RNA/µL were diluted 1:5 in their respective buffers for RNA quantitation by UV-spectrophotometry (Thermo Scientific, Nanodrop ND-1000). Protein concentrations were determined by BCA protein assay (23225, Thermo) using a microplate format and BSA as a protein standard. BCA reagent assay conditions were optimized according to manufacturer's recommendations for linearity at all protein concentrations examined.
RNase digestion of sample suspensions for SDS-PAGE
RNase digestions were performed in 0.2 mL thermocycler tubes (12 µL reactions) using 5 µL of clarified 1% LiDS TE sample suspensions containing <4.0 µg RNA/µL. RNase Cocktail (AM2286, Invitrogen), 10× RNase digest buffer (100 mM Tris-HCl pH 7.5, 1 M NaCl, and 10 mM EDTA), and 25× protease inhibitors (11836153001, Roche) were added to a final concentration of 2 µL RNase Cocktail/15 µg RNA, 1× RNase digestion buffer, and 1× protease inhibitors. A minimum of 0.2 µL RNase Cocktail was added regardless of RNA concentration. Samples were mixed by a brief vortex followed by a brief spin in a mini centrifuge. Untreated control samples were prepared without RNase Cocktail, and both were incubated for 2 h at 37°C in a thermocycler with heated lid (98°C).
SDS-PAGE and immunoblot
Sample loading buffer was prepared as a 5× stock (10% SDS, 50% glycerol, 312.5 mM Tris-HCl pH 6.8, and 0.1% [m/v] bromophenol blue [B8026, Sigma]) and diluted 3:1 with β-mercaptoethanol (v/v) for a working stock (LB WS). LB WS was added to samples to a final detergent concentration of 2% and denatured by incubating for 15 min at 65°C. Samples were separated on a 0.75 mm, 15-well, 4%–12% gradient polyacrylamide gel (6, 8, 10, 12% [1:1:1:1] resolver, 4% stacker) at constant voltage (80 V) for 1.5 h at RT. Following separation by SDS-PAGE, samples were transferred to nitrocellulose membranes using Bjerrum and Schafer-Nielsen transfer buffer (48 mM Tris and 39 mM glycine supplemented with 10% methanol and 0.03% SDS) and a Trans-Blot SD semidry electrophoretic transfer cell (170-3940, Bio-Rad). Alternatively, samples were wet transferred to nitrocellulose membranes using wet-transfer buffer (25 mM Tris, 96 mM glycine, 0.05% SDS, and 20% methanol) and a Bio-Rad Mini-Protean II system. Blocking and blotting conditions were performed according to those listed in Supplemental Table S4. Signal detection was performed using WesternBright ECL HRP substrate (K-12045, Advansta) and an Amersham Imager 600 imaging system.
Estimating protein-specific UV-crosslinking efficiencies by SDS-PAGE and immunoblot
Protein-specific UV-crosslinking efficiencies represent the percentage of total protein quantity that was UV-crosslinked to RNA and was estimated by comparing serial dilutions of RNase-treated UV-crosslinked input (total protein) sample and RNase-treated clRNP (total RNA-bound protein) fractions by SDS-PAGE and immunoblot as described previously (Kristofich and Nicchitta 2023). Loading was based on % fraction representing the percentage of starting sample/µL of sample volume.
Estimating protein-specific UV-crosslinking efficiencies by LC–MS/MS
Protein S/N ratios in clRNP fractions were estimated by SILAC LC–MS/MS, and protein abundances in input and clRNP fractions were estimated by LC–MS/MS as described in Kristofich and Nicchitta (2023) and included in Supplemental Table S1. Briefly, protein UV-crosslinking efficiency was calculated for each replicate using protein yields (µg protein/% fraction) of corresponding input and clRNP fractions: R1 = 1.31%; R2 = 1.28%; and R3 = 1.29% (Supplemental Fig. S8G; Kristofich and Nicchitta 2023). RNA-bound protein abundances (%TPS) in clRNP fractions were estimated for each replicate using protein S/N ratios, and RNA-bound abundance in input fractions was estimated using their respective protein UV-crosslinking efficiencies. Protein-specific UV-crosslinking efficiencies were calculated for each replicate using estimated total and RNA-bound abundances in input (total protein) samples. Data analyses were performed using average protein-specific UV-crosslinking efficiencies. Additional information is included as part of the source data files for Figure 3B and as part of Supplemental Table S1.
Statistical analysis software
All statistical analyses were performed using JMP Pro 17.0. Summary of statistical testing for all Figure panels was included as part of the provided Source Data file.
DATA ACCESS
MS data sets used for this study can be found in Supplemental Table S1.
SUPPLEMENTAL MATERIAL
Supplemental material is available for this article.
ACKNOWLEDGMENTS
We thank members of the Nicchitta laboratory for their helpful comments and critical feedback. Funding was provided by a grant from the National Institutes of Health (NIH) to C.V.N. (GM139480).
Footnotes
-
Article is online at http://www.rnajournal.org/cgi/doi/10.1261/rna.079848.123.
- Received September 21, 2023.
- Accepted February 12, 2024.
This article is distributed exclusively by the RNA Society for the first 12 months after the full-issue publication date (see http://rnajournal.cshlp.org/site/misc/terms.xhtml). After 12 months, it is available under a Creative Commons License (Attribution-NonCommercial 4.0 International), as described at http://creativecommons.org/licenses/by-nc/4.0/.
REFERENCES
MEET THE FIRST AUTHOR

Meet the First Author(s) is an editorial feature within RNA, in which the first author(s) of research-based papers in each issue have the opportunity to introduce themselves and their work to readers of RNA and the RNA research community. JohnCarlo Kristofich is the first author of this paper, “High-throughput quantitation of protein–RNA UV-crosslinking efficiencies as a predictive tool for high-confidence identification of RNA-binding proteins.” JohnCarlo did this work as a graduate student in the Nicchitta Lab, in the Department of Cell Biology at Duke University School of Medicine.
What are the major results described in your paper and how do they impact this branch of the field?
UV-based RNA-centric methods provide researchers a sought-after means for proteome-wide identification of cellular RNA-interactomes. Current UV-based RNA-centric method criteria for identification of candidate RNA-binding proteins (RBPs) are, however, largely dichotomous: if more of a given protein is recovered from UV-crosslinked samples than non-crosslinked controls, that protein is considered a candidate RNA-binding protein (RBP). Consequently, methodological approaches to the enrichment of proteins in UV-crosslinked samples can capture low-frequency, nonspecific interactions between RNAs and abundant cellular proteins, which represent false positives, and which may underlie the findings that an unexpectedly large fraction of proteome comprises candidate RBPs. The current work reports on a widely accessible high-throughput method for quantitation of proteome-wide UV-crosslinking efficiencies which represent the percentage of a given protein that is being crosslinked to RNA. It hasn't been feasible to perform this type of analysis at a proteome-wide scale and so this work provides a sought-after tool that will allow researchers to re-evaluate the many thousands of candidate RBPs identified to date. We demonstrate the utility of this approach in our current study by showing how bona fide RNA-binding proteins with established RNA regulatory functions display crosslinking efficiencies several orders of magnitude higher than candidate RBPs without previously established roles in RNA biology. In simple terms, it provides a sound quantitative basis for distinguishing RBPs engaged in stable and/or frequent interactions with RNAs and proteins which collide with RNAs in a nonspecific manner and at discernibly lower frequency. From this perspective, protein-specific UV-crosslinking efficiencies provide a useful quantitative metric for confidence-based assessment of physiologically relevant and nonspecific protein–RNA interactions. More broadly, the integration of UV-crosslinking efficiencies into predictive approaches for RBP identification provides proteome-wide information on RNA–protein interaction levels and can be used to interrogate RBP–RNA dynamics in response to cell state changes.
What led you to study RNA or this aspect of RNA science?
The Nicchitta Lab investigates mechanisms of mRNA localization to the ER membrane, which serves as a specialized translational hub in the cell. Over the last ten years, the advent and application of omic-level RBP identification methods have revealed a large number of candidate RBPs residing at the ER membrane. Initially, we were very excited about the prospect that these candidate RBPs might be involved in regulating mRNA localization and/or association with the ER. However, many of these candidate RBPs are localized within the luminal space of the ER, which is thought to be devoid of RNA, while others had well-established roles which do not involve direct interactions with RNA, so this made us question their authenticity as bona fide RBPs. Our efforts to validate their RNA-binding activity led us to develop the LEAP-RBP method and the approach reported in the current work, both of which have been indispensable for identifying and validating a handful of integral ER RBPs whose UV-crosslinking efficiencies merit further study of their RNA-binding functions.
During the course of these experiments, were there any surprising results or particular difficulties that altered your thinking and subsequent focus?
Of course, this is the most exciting aspect of doing science. Often, the data diverges from the hypothesis being tested. In these scenarios, I have found that taking a step back, embracing alternative perspectives, and conducting experiments to delineate the possibilities is often rewarded.
Are there specific individuals or groups who have influenced your philosophy or approach to science?
I consider myself fortunate for having the opportunity to learn from some exceptionally talented scientists. My undergraduate mentor, Professor Shelley Copley, greatly influenced my philosophy and encouraged me to ultimately pursue a rewarding career in science. My PhD supervisor, Professor Christopher Nicchitta, taught me the importance of “doing good science” and had an indelible impact on who I am as a scientist.




