


Chemi-Northern: a versatile chemiluminescent northern blot method for analysis and quantitation of RNA molecules
- Department of Biochemistry, Molecular Biology, and Biophysics, University of Minnesota, Minneapolis, Minnesota 55455, USA
- Corresponding author: agoldstr{at}umn.edu
-
Handling editor: Eric Phizicky
Abstract
This report describes a chemiluminescence-based detection method for RNAs on northern blots, designated Chemi-Northern. This approach builds on the simplicity and versatility of northern blotting, while dispensing of the need for expensive and cumbersome radioactivity. RNAs are first separated by denaturing gel electrophoresis, transferred to a nylon membrane, and then hybridized to a biotinylated RNA or DNA antisense probe. Streptavidin conjugated with horseradish peroxidase and enhanced chemiluminescence substrate are then used to detect the probe bound to the target RNA. Our results demonstrate the versatility of this method in detecting natural and engineered RNAs expressed in cells, including messenger and noncoding RNAs. We show that Chemi-Northern detection is sensitive and fast, detecting attomole amounts of RNA in as little as 1 sec, with high signal intensity and low background. The dynamic response displays excellent linearity. Using Chemi-Northern, we measure the reproducible, statistically significant reduction of mRNA levels by human sequence-specific RNA-binding proteins, PUM1 and PUM2. Additionally, we measure the interaction of the poly(A) binding protein, PABPC1, with polyadenylated mRNA. Thus, the Chemi-Northern method provides a versatile, simple, and cost-effective method to enable researchers to analyze expression, processing, binding, and decay of RNAs.
Keywords
INTRODUCTION
The need to detect and quantitate RNA molecules is pervasive in biological and medical research. Fortunately, multiple approaches are available, each of which has inherent strengths and limitations that an investigator should consider. For example, reverse transcription coupled with quantitative polymerase chain reaction (RT-qPCR) and whole transcriptome RNA sequencing (RNA-seq) are powerful tools (Bustin 2002; Shendure et al. 2017); however, those methods require expensive equipment and reagents and careful optimization of amplification and library generation steps. Moreover, RT-qPCR and RNA-seq detect small amplicons, limiting their ability to distinguish overlapping RNA isoforms, RNA processing and decay intermediates, and post-transcriptional modifications. Long-read sequencing technologies hold promise, though their high cost, technical, and equipment requirements remain a barrier to widespread routine application (Shendure et al. 2017).
A facile approach for RNA analysis that can be widely implemented with minimal cost and regulatory burden would be beneficial to researchers. Ideally, the method should be versatile in its ability to detect diverse RNA species from a variety of sources. It should offer sensitive detection and reproducible quantitation of RNA levels. Utilization of such a method would be improved by low cost, simplicity, and wide availability of reagents and equipment. For more than 40 years, the stalwart method that fits these criteria is northern blotting (Alwine et al. 1977; Green and Sambrook 2022). Northern blotting can be used to measure the size and level of intact RNAs, along with changes in their processing, modification, and metabolism. The procedure is simple (Fig. 1). First, an antisense nucleic acid probe corresponding to the target RNA is made. Second, the RNA is purified from the sample. Third, the RNA is physically separated based on size (i.e., charge-to-length ratio) via denaturing gel electrophoresis. Fourth, the RNA is transferred from the gel to a positively charged membrane. Fifth, the RNA of interest is detected through hybridization to an antisense probe coupled with a detectable signal.

Overview of RNA detection by Chemi-Northern method. The Chemi-Northern protocol consists of five steps: (1) Generation of biotinylated (purple pentagon) antisense nucleic acid probe (black line). As an example, an ethidium bromide (EtBr)-stained denaturing formaldehyde–MOPS agarose gel of the firefly luciferase (Fluc) and nanoluciferase (Nluc) RNA probes used in this study are shown on the right. An RNA size marker is included on the left, with sizes indicated in nucleotides (nt). (2) Extraction and purification of RNA (red line). As shown on the right, RNAs can be purified from diverse sources using a variety of methods including organic phase separation (e.g., TRIzol reagent), spin column, or bead-based methods (e.g., RNA coimmunoprecipitation [RIP] assays). (3) Separation of RNA by charge-to-length ratio by denaturing formaldehyde–MOPS agarose gel electrophoresis. (4) Blotting transfer and immobilization of RNA to positively charged nylon membrane. (5) Visualization of target RNA hybridized to the biotinylated probe using streptavidin–HRP conjugate and enhanced chemiluminescence (ECL) detection. Gel, column, and test tube icons were created by Biorender.com under academic license agreement NE25MGJNLD.
Traditionally, probes for northern blotting were labeled by incorporation of radioactive 32P, which enabled detection by autoradiography or, subsequently, by phosphorimaging (Alwine et al. 1977; Green and Sambrook 2022). However, several factors have diminished the adoption of radioactive northern blots. First, the use of radioactive material requires special licensing, regulatory oversight, procedures, equipment, and facilities. Second, the cost of radioactive nucleotides has substantially increased. Third, the short 14-d half-life of 32P necessitates frequent production of probes (Unterweger 2002). As a result, we sought to implement and optimize a cost-effective nonradioactive northern blotting method.
Several nonradioactive approaches for probe-labeling and detection have been described (Martin et al. 1990; Düring 1993; Rayner et al. 1994; Trayhurn et al. 1994; Kessler 1995; Low and Rausch 1996; Meltzer et al. 1998; Wu et al. 2013; Miller et al. 2018). For our application, we selected labeling with biotinylated UTP due to its wide availability, ease of incorporation into probes, low cost relative to other labels, and strong and specific interaction with streptavidin (Green and Sambrook 2021). For detection of biotin, streptavidin conjugated to horseradish peroxidase is available from multiple commercial sources and is quite affordable. We chose luminescence detection due to its high sensitivity and prevalence in laboratory applications—the same method is widely used for western blotting (Kricka 2018). Moreover, chemiluminescence detection is fast and sensitive and its quantitative capabilities are bolstered by improved CCD-camera-based imaging systems.
In this report, we present an optimized northern blot method that utilizes chemiluminescence detection and biotinylated antisense nucleic acid probes (hereon referred to as Chemi-Northern) (Fig. 1). The probes can be made “in-house” or purchased from commercial sources. After hybridization to the target RNA on the blot, the probes are detected using streptavidin conjugated to horseradish peroxidase and ECL substrate. Importantly, all of the reagents and equipment are widely available and commonplace in molecular biology laboratories. The cost per experiment is lower than other methods. To demonstrate the utility of Chemi-Northern, we test its dynamic range and sensitivity for multiple RNAs (including reporter gene and endogenous mRNAs and noncoding RNA) present in RNA isolated from human and Drosophila cells. Our results show that attomole sensitivity is possible with excellent linearity in response with detection times of only a few seconds. We show that Chemi-Northern accurately and reproducibly measures the regulation of a reporter mRNA by the sequence-specific RNA-binding proteins PUM1 and PUM2. Furthermore, we use the method to measure the enrichment of a reporter mRNA with the poly(A) binding protein, PABPC1. Our results show that Chemi-Northern is a versatile, effective method to analyze RNAs.
RESULTS
Synthesis of biotinylated nucleic acid probes
Chemi-Northern detection uses biotinylated antisense nucleic acid probes—either RNA or DNA. Labeled probes of single-stranded RNA, transcribed in vitro, are commonly used for high sensitivity and ease of production (Melton et al. 1984; Milligan et al. 1987; Milligan and Uhlenbeck 1989). To generate an RNA probe, a DNA template for in vitro transcription is first produced with the appropriate promoter sequence. Suitable templates include PCR products, plasmids, or DNA oligonucleotides. We used the bacteriophage T7 RNA polymerase to transcribe probes for Fluc and Nluc reporter mRNAs from PCR-generated templates amplified with specific primers; each reverse primer contained a 5′ T7 promoter sequence 5′-TAATACGACTCACTATAGGG (the underlined G is the first nucleotide of the transcript) (see Materials and Methods). The Nluc and Fluc probes correspond to those that we used for radioactive northern blotting in previous studies (Arvola et al. 2020; Enwerem et al. 2021). The RNA probes were labeled with biotin during transcription using a mixture of NTPs with a biotin-16-UTP:UTP ratio of 1:2. After transcription, the RNA probes were purified using a spin column-based purification kit (e.g., RNA Clean & Concentrator Kit, Zymo Research). Unlike radioactive probes, the biotinylated probes can be conveniently measured by UV absorbance (biotin does not absorb in the UV spectrum) and are stable when stored at −80°C. The purified probes were also visualized by denaturing formaldehyde–MOPS agarose gel electrophoresis (Fig. 1), confirming their proper size and purity. Though biotin is randomly incorporated by T7 polymerase, the resulting probes run as a diffuse, single band of slightly higher apparent molecular weight, as previously observed (Low and Rausch 1996).
As an alternative probe format, we purchased synthetic antisense DNA oligonucleotides with a 5′ biotin modification corresponding to β-actin (ACTB) mRNA and 7SL noncoding RNA. The general guidelines for DNA oligo probe design include lengths of 25–45 nt with melting temperature (Tm) between 78°C and 90°C and GC content ranging from 45% to 65%, as recommended by the manufacturer of the hybridization buffer (see Materials and Methods). As such, the β-actin DNA probe was 41 nt with 59% GC content and a Tm of 71°C. The DNA probe used to detect 7SL RNA was 45 nt with a 60% GC content and Tm of 75°C.
Dynamic detection of reporter mRNAs expressed in cells using Chemi-Northern
To test the efficacy of the Chemi-Northern approach, we first sought to detect luciferase reporter mRNAs expressed in human and Drosophila cells. To assess the dynamic response of detection, HCT116 colon cancer cells were transfected with increasing amounts of Nluc reporter expression plasmid (from 250 to 2000 ng of transfected plasmid per well of a six-well plate). After 48 h, total cellular RNA was purified using magnetic bead-based isolation, which incorporates on-bead DNase digestion to remove DNA. As a negative control, total RNA from untransfected cells was also analyzed. The concentration of the cellular RNA was determined by UV absorbance and the integrity of the RNA was assessed by EtBr-stained, denaturing formaldehyde–MOPS agarose gel electrophoresis of 5000 ng of each RNA sample. Imaging of the gel demonstrated that the 28S and 18S ribosomal RNAs (rRNAs) were intact (Fig. 2A,B).
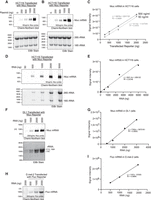
Dynamic response range of mRNA detection by Chemi-Northern using biotinylated RNA probes. HCT116 cells were transfected with increasing amounts (250, 500, 1000, and 2000 ng) of Nluc reporter plasmid, as indicated at the top. The “0” ng condition indicates “mock” transfected cells. A total of 5 µg of purified cellular RNA was loaded into each lane of the denaturing formaldehyde–MOPS agarose gel and detected via Chemi-Northern using 50 ng/mL (A) or 500 ng/mL (B) of biotinylated antisense Nluc RNA probe with 8% biotinylated nucleotides. Chemi-Northern blot of expressed Nluc mRNA (639 nt + pA tail) at 1 sec exposure time is shown in the upper panels, and EtBr stain of rRNA (18S, 1869 nt and 28S rRNA, 5070 nt), serving as a loading control and indication of RNA integrity, are shown in the lower panels. (C) Graph showing the linear relationship between the transfected reporter (x-axis) and signal intensity (y-axis) of Chemi-Northern blot at two different probe concentrations (50 and 500 ng/mL). The linear regression equation, y = mx + b, and coefficient of determination, R2 , are reported. All blots were quantified using AzureSpot Pro and graphs were created using GraphPad Prism software. (D) HCT116 cells were transfected with 1.25 µg of Nluc reporter plasmid, and the purified total RNA was titrated (50, 500, 1000, 2500, and 5000 ng) and expressed. Nluc mRNA was detected at 1 sec exposure by Chemi-Northern blot (upper panel) and EtBr stain (lower panel). (E) Quantitation and linear fit between total RNA mass (ng, x-axis) and signal intensity (y-axis). RNA was analyzed from Drosophila DL1 cells (F, G) or D.mel-2 cells (H, I) transfected with Nluc (806 nt + pA tail) or Fluc (1773 nt + pA tail) reporters using Chemi-Northern. The Nluc and Fluc probes each had 8% biotinylated nucleotides in this experiment. Purified total cellular RNA was titrated as indicated at the top of the gels. Note that in panel F, the bottom panel shows the Drosophila rRNA species stained with EtBr, of which the 28S rRNA (3945 nt) is naturally processed into two fragments (1787 and 2112 nt), whereas the 18S rRNA is 1995 nt, as previously documented (Long and Dawid 1980; Tautz et al. 1988). (G, I) Quantitation of signal intensity relative to the amount of total cellular RNA analyzed.
The RNA was transferred from the gel to a positively charged nylon membrane by downward capillary blotting and cross-linked by exposure to UV (Chomczynski and Mackey 1994). The membrane was then “prehybridized” by incubating with a hybridization buffer. We use ULTRAhyb Ultrasensitive Hybridization Buffer (Thermo Fisher Scientific) with excellent results. As an alternative, users may make their own hybridization buffer according to established procedures (Green and Sambrook 2022). For hybridization, we initially tested two concentrations of biotinylated riboprobes (50 ng/mL [241 pM] and 500 ng/mL [2.41 nM]) to determine if there was an effect on the detection range. After probe hybridization, the membrane was extensively washed. To detect the mRNA-bound biotinylated probe, the membrane was blocked and then incubated with conjugated streptavidin–HRP followed by ECL substrate. The membrane was imaged using a CCD-camera-based western blot imaging system. The resulting images were analyzed using software supplied with the imaging system, enabling quantitation of the signal intensity for each band and background correction.
For both 50 ng/mL (Fig. 2A) and 500 ng/mL (Fig. 2B) of the probe, Nluc mRNA was detected within 1 sec with linear response ranges from 250 to 2000 ng of transfected reporter plasmid (Fig. 2C). The Nluc mRNA signal was only present in transfected samples, demonstrating specificity, with high signal intensity and low background noise. The results also indicate that the probe is in excess under these conditions, since the signal intensities were nearly identical across the response range (Fig. 2C).
To further test Chemi-Northern detection, we analyzed a titration of total cellular RNA (50–5000 ng) from HCT116 cells transfected with 1.25 μg of Nluc expression plasmid. Nluc mRNA was detected by a 1 sec exposure in as little as 250 ng of total RNA (Fig. 2D) with signal intensity that was proportional to the amount of total (Fig. 2E). We also used Chemi-Northern to detect Nluc (Fig. 2F) and Fluc mRNAs (Fig. 2H) expressed in cultured Drosophila cells. This experiment used a shorter 187 nt biotinylated RNA probe that hybridized to the Nluc 3′UTR, which was previously used for radioactive northern blotting (Arvola et al. 2020). Quantitation of these blots provides additional evidence for the linear response of the assay (Fig. 2G,I).
Detection of endogenous RNAs using DNA oligonucleotide probes by Chemi-Northern
We used Chemi-Northern to detect two endogenous RNAs, including the β-actin mRNA and the 7SL noncoding RNA. For this application, we used biotinylated synthetic DNA oligonucleotide probes in a hybridization buffer optimized for oligonucleotide probes (ULTRAhyb-Oligo Hybridization Buffer, Thermo Fisher Scientific). β-actin mRNA and 7SL RNA were readily detected in as little as 500 ng of total HTC116 RNA using 5 nM of each probe (Fig. 3A) with an excellent linear response in signal intensity proportional to the amount of total RNA (Fig. 3B,C). Similar results were obtained using a biotinylated DNA oligonucleotide to the Drosophila 7SL ncRNA (Fig. 3D,E). Thus, Chemi-Northern effectively detects endogenous RNAs using synthetic probes with a single biotin label.
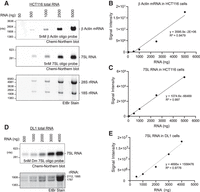
Chemi-Northern using biotinylated DNA probes detects endogenous messenger and noncoding RNAs. (A) Total RNA was purified from HCT116 cells and titrated (50, 100, 1000, 2500, and 5000 ng) onto a formaldehyde agarose gel, followed by Chemi-Northern blotting using 5′ biotinylated DNA oligonucleotide antisense probes for endogenous β-actin (ACTB) mRNA at 85 sec exposure (1812 nt + pA tail, upper panel) and 7SL ncRNA at 1 sec exposure (299 nt, middle panel). EtBr staining of rRNAs is shown in the lower panel. Quantitation and graphs showing the linear fit of the total RNA mass (ng) versus signal intensity of the β-actin mRNA (B) and 7SL RNA (C). (D) Total RNA of Drosophila DL1 cells titrated and endogenous 7SL (299 nt) and detected via Chemi-Northern blot at 1 sec exposure. (E) Quantitation of signal intensity of 7SL RNA relative to total cellular RNA.
Attomole sensitivity of Chemi-Northern detection
We next wished to test the sensitivity range of Chemi-Northern detection. To do so, we transcribed and purified an RNA corresponding to Nluc mRNA (Fig. 4A). We then analyzed a titration of Nluc mRNA from 50 to 1690 attomoles (0.01–0.35 ng) (Fig. 4B). The Chemi-Northern using the biotinylated Nluc antisense RNA probe detected as little as 240 attomoles (0.05 ng) of RNA with a linear response observed across the range (Fig. 4B,C). We then tested the ability of Chemi-Northern to measure the amount of a specific transcript within a total RNA sample. To do so, we added a known amount of pure Nluc mRNA (0.35 ng) to the total RNA purified from HCT116 cells (2.5 µg). We then performed Chemi-Northern and compared the Nluc signal intensities in the standard curve of pure Nluc mRNA to that in the total RNA samples. The results show that the signal intensity of Nluc in the total RNA was equivalent to 0.35 ng in the standard curve (Fig. 4D,E). Therefore, Chemi-Northern detection can be used for absolute quantitation of mRNA abundance in an RNA sample.
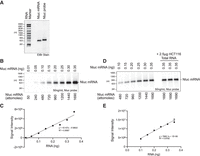
Attomole sensitivity of Chemi-Northern detection. (A) EtBr-stained denaturing formaldehyde–MOPS agarose gel of 500 ng in vitro transcribed, purified synthetic Nluc mRNA and biotinylated Nluc antisense probe RNA (623 nt), confirmed the proper size, purity, and quality. RNA size marker is included with nucleotide (nt) lengths indicated on the left. We note that the migration of the Nluc probe RNA is slightly retarded due to the incorporation of biotinylated uridine. (B) Chemi-Northern detection of titrated synthetic Nluc mRNA at 6 sec exposure. The amount of the Nluc mRNA is indicated, with mass at the top and moles at the bottom. (C) Measured signal intensities in panel B are graphed relative to the amount of mRNA. Linear regression analysis was performed to assess the dynamic response, with the resulting line, equation, and coefficient of determination, R2. (D) Chemi-Northern detection of titrated synthetic Nluc mRNA at 6 sec exposures along with three samples containing 2.5 µg of total HCT116 RNA and synthetic Nluc RNA. The mass of synthetic Nluc mRNA in each lane is indicated at the top, and the number of moles is indicated at the bottom. (E) Measured signal intensities of the Nluc RNA (panel D) are graphed relative to the amount of Nluc RNA across the titration range (black circles). Linear regression analysis was performed to assess the dynamic response, with the resulting line, equation, and coefficient of determination, R2. Signal intensity for the three samples containing 0.35 ng of Nluc RNA in 2.5 µg of total HCT116 RNA is shown as light gray circles.
Enhanced sensitivity by optimizing biotin incorporation into the RNA probe
We reasoned that the sensitivity of detection by Chemi-Northern could be enhanced by incorporating more biotinylated uridine into the RNA probe. To test this idea, we transcribed a 197 nt Nluc 5′-UTR RNA probe in reactions containing an increasing ratio of biotinylated UTP to unlabeled UTP, while maintaining the same overall concentration. The probes were successfully produced at ratios of biotinylated UTP:UTP spanning 1:2 to 3:1, but not at 1:0 (Fig. 5A). Assuming equivalent incorporation of biotinylated UTP and UTP into the RNA, we calculated the percentage of biotinylated nucleotides in the synthetic probes to be ∼10% using the 1:2 ratio and 21% for the 3:1 ratio. We noted a slight decrease in mobility of the probe produced at 3:1 ratio, indicative of the more densely incorporated bulky biotinylated uridine. We then probed identical blots with three amounts of total cellular RNA from HCT116 cells transfected with the Nluc reporter gene with either the 1:2 or 3:1 Nluc 5′-UTR RNA probes. The same blots were probed with 7SL DNA oligo probe, serving as an internal control. The blots were visualized side-by-side under identical conditions, revealing a stronger signal from the 3:1 Nluc 5′-UTR RNA probe (Fig. 5B). Quantitation of the signal intensities for each RNA amount, normalized to the corresponding 7SL signal, demonstrates an average 5.4-fold increase in detection by the more heavily biotinylated 3:1 probe (Fig. 5C). Thus, the sensitivity of Chemi-Northern can be enhanced by optimizing the degree of biotinylation of the RNA probes. We find that the 1:2 ratio works well for producing most probes. When increased sensitivity is needed, we recommend optimizing the biotinylation of the probe to maximize label incorporation.
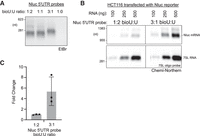
Enhanced sensitivity by optimizing biotin incorporation into RNA probe. (A) EtBr-stained denaturing formaldehyde–MOPS agarose gel of Nluc 5′-UTR RNA probes that were transcribed in vitro using the indicated ratios of biotinylated UTP (bioU) to unlabeled UTP. Total UTP concentration was the same in all reactions. Assuming equal incorporation of bioU and U, we estimate this probe will contain 10% biotinylated nucleotides at the 1:2 bioU:U ratio and 21% biotinylated nucleotides at the 3:1 bioU:U ratio. (B) Chemi-Northern detection was performed on identical blots using Nluc 5′-UTR probe with the indicated ratio of bioU:U. The gels were analyzed and imaged under identical conditions using the same exposure setting. 7SL RNA was detected using a biotinylated DNA oligo probe on the same blots, as a loading control. (C) Quantitation of the Chemi-Northern signals in panel B. Signal intensity for Nluc in each lane was normalized to its corresponding 7SL RNA signal. Fold change was then calculated relative to the mean value of the 1:2 bioU:U probe. The mean, SD, and the three data points for each condition are shown in the graph.
Detection of low to moderately expressed endogenous mRNAs
Having demonstrated the ability of Chemi-Northern to detect RNAs that are highly expressed in cells (e.g., β-actin and 7SL in Fig. 3), we next analyzed mRNAs with moderate to low expression levels using probes synthesized with the 3:1 ratio of biotinylated UTP:UTP. First, we detected the moderately expressed housekeeping gene, β2 microglobin (B2M), which was fourfold less abundant than β-actin mRNA in our published RNA-seq data set from HCT116 cells (2446 vs. 10,275 mean counts, respectively) (Enwerem et al. 2021). The B2M mRNA was readily detected by Chemi-Northern in as little as 500 ng of total RNA (Fig. 6A,B). We also analyzed two low-level mRNAs including the Golgi membrane protein, GRIP, and coiled-coil domain containing 2 (GCC2, with 211 mean counts, 50 times less than β-actin mRNA) (Fig. 6C,D), and the RNA exonuclease encoding gene, DIS3L (50 mean counts, 200 times less than β-actin mRNA) (Fig. 6E,F), both of which were also readily detected in total RNA. We note that two bands are visible on the GCC2 blot (Fig. 6C). The upper band corresponds to the major protein-coding isoform 1, which is expected to be 6909 nt in length. Additional GCC2 mRNA isoforms are likely to represent products of alternative 3′-end processing through several cleavage/polyadenylation sites present in the 3′UTR. Together, this analysis demonstrates the ability of Chemi-Northern to detect transcripts with expression spanning low to high levels.
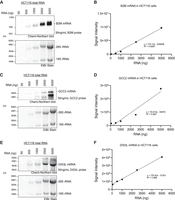
Detection of low to moderately expressed endogenous mRNAs with increased sensitivity. (A) Total RNA was purified from HCT116 cells and titrated (50, 100, 1000, 2500, and 5000 ng) onto a formaldehyde agarose gel followed by Chemi-Northern blotting using biotinylated RNA antisense probes (19% biotinylated nucleotides) synthesized using a 3:1 bioU:U ratio to detect moderately expressed endogenous B2M mRNA (943nt + pA tail). The exposure time was 7 sec. EtBr staining of rRNAs is shown in the lower panel. (B) Graph of quantitation of panel A showing linear fit of the total RNA mass (ng) versus signal intensity of the B2M. (C) The lowly expressed GRIP and coiled-coil domain containing 2 (GCC2) mRNA (6909nt + pA tail) was detected with a 10 sec exposure with a probe containing 25% biotinylated nucleotides. (D) Graph of quantitation of GCC2 mRNA in panel C. (E) The lowly expressed DIS3-like exosome 3′–5′ exoribonuclease (DIS3L) mRNA (3780 nt + pA tail) was detected at 10 sec exposure using a probe with 23% biotinylated nucleotides. (F) Graph of quantitation of DIS3L mRNA in panel E.
Reproducible measurement of mRNA regulation and protein–RNA binding using Chemi-Northern
To demonstrate the utility of Chemi-Northern for analysis of mRNA regulation and assess the reproducibility of the results, we measured the effect of sequence-specific RNA-binding proteins, human PUM1 and PUM2, on the levels of Nluc reporter mRNAs. PUM proteins are repressors that bind and degrade mRNAs that contain one or more Pumilio response elements (PRE: 5′-UGUANAUA) (Bohn et al. 2018; Goldstrohm et al. 2018; Enwerem et al. 2021). We compared Nluc reporter mRNAs that contained three copies of the wild-type PRE (Nluc 3×PRE) to a matched version wherein the first 3 nt of the PRE were mutated to prevent PUM-binding (Nluc 3×PREmt, 5′-UGU changed to ACA). Consistent with our previous results (Van Etten et al. 2012; Bohn et al. 2018; Enwerem et al. 2021), the Nluc 3×PRE mRNA was significantly and reproducibly reduced in three biological replicates relative to the mutant 3×PREmt version (Fig. 7A,B). In this context, Chemi-Northern produced results identical to those we previously obtained using radioactive northern detection (Van Etten et al. 2012; Arvola et al. 2020; Enwerem et al. 2021), but with dramatically shorter exposure time (seconds for Chemi-Northern vs. overnight exposure for radioactive northern) and lower cost.
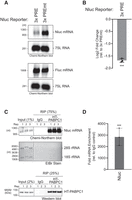
Chemi-Northern reproducibly measures mRNA regulation and binding by RNA-binding proteins. (A) Regulation of the Nluc reporter mRNA with three wild-type Pumilio response elements (3×PRE) in its 3′UTR was compared to the mutant version (3×PREmt) using Chemi-Northern. The PREs are specifically recognized by endogenous sequence-specific RNA-binding proteins, PUM1 and PUM2, which repress by causing degradation of the mRNA, as previously documented (Van Etten et al. 2012; Bohn et al. 2018; Wolfe et al. 2020; Enwerem et al. 2021). Reporters were expressed in HCT116 cells. The Fluc mRNA served as a control for transfection efficiency (the Fluc probe has 7% biotinylated nucleotides). Nluc mRNA was detected at 5 sec exposure and Fluc mRNA at 10 sec. The 7SL RNA served as an internal control for equivalent loading of each gel and was imaged at 5 sec exposure time. (B) Quantitation of Chemi-Northern in panel A and three additional biological replicates. Log2 fold change of the Nluc 3×PRE reporter was determined relative to the mutant version, Nluc 3×PREmt, in each sample and was calculated as described in Materials and Methods. Mean and SD values are plotted, along with the values of each of the replicates. Statistical significance (***) P = 0.0005 based on unpaired two-tailed t-test. (C) Nluc mRNA is enriched by RIP of human RNA-binding protein PABPC1, expressed as a fusion to Halotag (HT-PABPC1) from HCT116 cells, wherein the endogenous PABPC1 and PABPC4 paralogs were depleted (see Materials and Methods). The top image shows the Chemi-Northern detection of the polyadenylated Nluc mRNA at 40 sec exposure in the input samples and the robust enrichment in the HT-PABPC1 RIP samples, but not the IgG negative control RIPs. The middle image shows the EtBr-stained denaturing formaldehyde–MOPS agarose gel from input and RIP samples. Ribosomal RNAs are clearly visible in the inputs, but not in RIP samples. The image at the bottom shows the western blot of the HT-PABPC1 protein, demonstrating its presence in the input samples and enrichment in the RIP samples. Dashed vertical lines in the panels indicate that the images were cropped to show relevant lanes. For each image, all of the lanes are from the same blot and exposure. (D) Quantitation of the Chemi-Northern in C demonstrates significant, reproducible detection of Nluc mRNA in the PABPC1 RIP samples. Nluc RNA signal intensity in each RIP sample was normalized to its corresponding input sample, then the fold enrichment in the PABPC1 RIP was calculated relative to the IgG negative control. The mean and SD values are plotted, along with the values of each of the three biological replicates. Statistical significance (***) P = 0.0005 based on an unpaired two-tailed t-test.
We also applied Chemi-Northern to detect RNA–protein interactions in an RIP assay. We immunoprecipitated the polyadenosine binding protein PABPC1, which interacts with the 3′ poly(A) tail of mRNAs to control their translation and stability. For this experiment, PABPC1 was expressed as a fusion to Halotag (HT-PABPC1) from a transfected plasmid in HCT116 cells wherein the two endogenous cytoplasmic PABP isoforms, PABPC1 and PABPC4, were depleted using auxin-inducible degradation (Xiang and Bartel 2021) and RNA interference, respectively. These HCT116 cells also coexpressed polyadenylated Nluc mRNA, which was then detected by Chemi-Northern. HT-PABPC1 was immunoprecipitated from the cell extract using a specific PABPC1 antibody, and then the associated RNA was purified from the RIP and input materials. As a negative control, a mock RIP was performed from the cell extract using nonspecific immunoglobulin (IgG). Chemi-Northern detected Nluc mRNA in the HT-PABPC1 RIP (Fig. 7C), whereas rRNAs were not enriched (as detected by EtBr staining of the gel). Western blot analysis confirmed the presence of HT-PABPC1 in the RIP samples. Quantitation of the Chemi-Northern shows substantial and reproducible enrichment of the Nluc mRNA relative to the negative control (Fig. 7D), and the efficiency of recovery of the Nluc mRNA in the HT-PABPC1 RIP was 49% ± 11% of the total input. These results demonstrate the utility of Chemi-Northern for detecting interactions of an RNA-binding protein with an RNA.
DISCUSSION
Northern blotting has proven to be a valuable methodology to detect and quantitate RNAs in many applications. The Chemi-Northern approach described here expands its usefulness. As examples, we demonstrate its versatility by analyzing intact RNA molecules—both mRNAs and noncoding RNAs, natural and engineered—in total RNA or RIP assays. Chemi-Northern has multiple advantages when compared to traditional northern blotting and alternative RNA analysis methods: (i) The challenges associated with the use of radioactive nucleotides are relinquished. (ii) The procedure is simple. (iii) The necessary reagents and equipment are minimal, widely available, and prevalent in molecular biology laboratories. (iv) The cost per assay is relatively low compared to other techniques. Based on prices at the time of this publication, we estimate ∼$100 per blot for supplies. (v) Chemi-Northern probes are easy to create and are stable. (vi) Chemiluminescence detection is fast, with exposure times as short as 1 sec. Overall, the Chemi-Northern procedure can be completed in 2 d. (vii) Chemi-Northern is sensitive: Detection of attomole amounts of RNA is readily achievable. For lower abundance RNAs, detection can be boosted by increasing the incorporation of biotin into the probe. We also suggest that enrichment of the target RNA, such as poly(A) selection of mRNAs (Rio et al. 2010), could further enhance detection. (viii) Chemi-Northern is quantitative. Our results show excellent linearity and dynamic range. The signal intensity is high with low background noise. Moreover, the measurements proved to be reproducible, enabling us to quantitate mRNA regulation by human PUM proteins and RNA-binding by PABPC1. We anticipate that the Chemi-Northern approach will be useful to the scientific community, empowering their research on RNA biology, gene regulation, and disease mechanisms.
MATERIALS AND METHODS
Plasmids
The following plasmids were used in this study:
The PABPC1 coding region was inserted into the Sgf1 and Pme1 sites of the pFN21K vector (Promega) using the Flexi cloning procedure (Promega).
In vitro transcription of RNAs
DNA templates used to transcribe the biotinylated antisense RNA probes corresponding to Nluc and Fluc were generated by PCR using the Nluc plasmid, pNLP MCS, and Fluc plasmid, pGL4.13, respectively. The following primers were used for PCR, and the reverse primer incorporated the promoter for T7 RNA polymerase (underlined):
-
Nluc probe F: 5′-CACTCGAAGATTTCGTTGGGGAC
-
Nluc probe R: 5′-GGATCCTAATACGACTCACTATAGGGGATGCGAGCTGAAGCACAAGC
-
Fluc probe F: 5′-CGAGATGAGCGTTCGGCTGGCAGAA
-
Fluc probe R: 5′-GGATCCTAATACGACTCACTATAGGGCCGAAGCCGTGGTGAAATGGCA
Transcription from the Nluc template produces a 623 nt RNA probe that is complementary to the Nluc coding sequence. The Fluc template produces a 576 nt RNA probe complementary to the Fluc coding sequence.
The DNA template for transcription of the synthetic Nluc mRNA was generated using the following primers:
-
Nluc Sense F: 5′-GGATCCTAATACGACTCACTATAGGGAGACACTCGAAGATTTCGTTGGGGAC
-
Nluc Sense R: 5′-GATGCGAGCTGAAGCACAAGC
Transcription from this template produces a 623 nt RNA within the Nluc coding sequence.
The DNA template for the transcription of the Nluc 5′-UTR RNA probe was generated by PCR from the following gBlock gene fragment (IDT) sequence:
-
5′-CTCTGAGCTATTCCAGAAGTAGTGAGGAGGCTTTTTTGGAGGCCTAGGCTTTTGCAAAAAGCTTGATTCTTCTGACACAACAGTCTCGAACTTAAGCTGCAGAAGTTGGTCGTGAGGCACTGGGCAGGTGTCCACTCCCAGTTCAATTACAGCTCTTAAGGCTAGAGTACTCCCTATAGTGAGTCGTATTAGGATCC
PCR was performed using the following primers:
-
Nluc 5′-UTR probe F: 5′-CTCTGAGCTATTCCAGAAGTAGTGAGGAG
-
Nluc 5′-UTR probe R: 5′-GGATCCTAATACGACTCACTATAGGGAGTACTCTAGCCTTAAGAGC
Transcription from this template generated a 174 nt probe.
For luciferase reporters in Drosophila cells, DNA templates were similarly used to transcribe biotinylated antisense RNA probes. The template for the Nluc 3′-UTR probe was generated by PCR from the pAC5.1 Nluc MCS plasmid as previously described (Arvola et al. 2020) using the following primers:
-
Nluc 3′-UTR probe F: 5′-GGTTGAAGAGCAAGCCGC
-
Nluc 3′-UTR probe R: 5′-GGATCCTAATACGACTCACTATAGGGGCGGCCAGCGGC
Transcription from this template generates a 187 nt probe with 124 nt complementarity to the 3′UTR of the Nluc reporter.
The template for the Fluc probe was generated by PCR from pAC5.1 Fluc pA plasmid using the following primers:
-
Fluc probe F: 5′-TAAGACACTGGGTGTGAACCAGCGCG
-
Fluc probe R: 5′-GGATCCTAATACGACTCACTATAGGGCTTGGCCTTAATGAGAATCTCGCGGA
Transcription from this template generates a 493 nt probe complementary to the Fluc coding region.
The template for the B2M probe was generated by PCR from the following gBlock gene fragment (IDT) sequence:
-
5′-GGATCCTAATACGACTCACTATAGGGCATGTCTCGATCCCACTTAACTATCTTGGGCTGTGACAAAGTCACATGGTTCACACGGCAGGCATACTCATCTTTTTCAGTGGGGGTGAATTCAGTGTAGTACAAGAGATAGAAAGACCAGTCCTTGCTGAAAGACAAGTCTGAATGCTCCACTTTTTCAATTCTCTCTCCATTCTTCAGTAAGTCAACTTCAATGTCGGATGGATGAAACCCAGACACATAGCAATTCAGGAAATTTGACTTTCCATTCTCTGCTGGATGACGTGAGTAAACCTGAATCTTTGGAGTACGCTGGATAGCCTCCAGGCCAGAAAGAGAGAGTAGCGCGAGCACAGCTAAGGCCACGGAGCGAGA
PCR was performed using the following primers:
-
B2M probe F: 5′-GGATCCTAATACGACTCACTATAGGGCATGTCTCGATCCC
-
B2M probe R: 5′-TCTCGCTCCGTGGCCTTAGCTGTGCTCGCGCTACTCTCTC
Transcription from this template generates a 357 nt RNA probe complementary to the B2M coding sequence.
The template for the GCC2 probe was generated by PCR from the following gBlock gene fragment (IDT) sequence:
-
5′-GGATCCTAATACGACTCACTATAGGGCCTCACCTTGAGCAACCGCAGCAAGTTTTCCCTTTTCTTCAGGGCTGAGCTGCAACATCGTATTTATAACAGGAAGAAGTCTCTCTCTTTCACTACCTGGTTTCAAGAAAATGAACTGCAGCAAGACGTTCTTCAAGTATTCCAGGTTAGCTGCAGACTTCTCTCGCTCTTGATTCCTTTCCAATCTTCTTATTTCACTTTTGAGAAGCTTAATTTGCTCCATAAGAATTGCATTGGTTGCTTCTGTTTCCCGAAGCAGGCCGTTTAAGTGATCTGCACTTTTTGTGGTGGAACTGAGCTTCTGAACCAATTCTTCTTTGGTAAATTCAGCATGCCATAATGGAGGCTCAAGTTTAGTTTCGGGAGAGTTAAGCAGCTGCTCTAAAGACTGTGTGTATGTGCTGGCGGAAGACACAGACTCCGTATCAGTTGTCTCCATGCCTTCTCCCTCTTCCCGGGTTACAGTGTGCATGTCTAGAAGCGGGAGGTCTGTGTTTCTCC
PCR was performed using the following primers:
-
GCC2 probe F: 5′-GGATCCTAATACGACTCACTATAGGGCCTCACCTTGAGCA
-
GCC2 probe R: 5′-GGAGAAACACAGACCTCCCGCTTCTAGACATGCACACTG
Transcription from this template generates a 504 nt RNA probe complementary to the GCC2 coding sequence.
The template for the DIS3L probe was generated by PCR from the following gBlock gene fragment (IDT) sequence:
-
5′-GGATCCTAATACGACTCACTATAGGGACTCGCCCGAAGCCTTGTCGTCACAGTCATTCTCACACAGGGCTACGGTTCTTCCTTTCCATTCATTTTTAGGAAGCAGCTCCACAACTACCACATCTCCATGAATTGAGCGGTTTCGAGCCTTCATCCCGTGGATTAGGATGTCACTGACTAAATCTGAATCTTTACTGCTGGCTCCTTGAAGTCGAACAAAAGCTTCTATTTGGGCTCTGTGTTTGTTGACATTCAGAATTCCCTGGATATAGCGTCCAGATTTAATCCCAGCTTCTAACACTTCCAGGGGAAGATGTTCTGGGTACTCCTTCCCATGGCTCTCCTGACTCTCATTCTCTCTCTCCCGTCGAGACTGAAGGATAGAATCACAAAGCTCGTGGGCAGCTTTTAAATCAGGCCAGAAATTGTCCAGGTAATTCTTGAAAGTAATCACGAATACTCCTTCTGTTTCACTTCCATACTGCTGAATTGCCTCTTCATCTTCTGTCACCATAACAATTGGC
PCR was performed using the following primers:
-
DIS3L probe F: 5′-GGATCCTAATACGACTCACTATAGGGACTCGCCCGAAGCC
-
DIS3L probe R: 5′-GCCAATTGTTATGGTGACAGAAGATGAAGAGGCAATTCAGC
Transcription from this template generates a 500 nt RNA probe complementary to the DIS3L coding sequence.
PCR-generated DNA templates were purified using DNA Clean & Concentrator-25 spin columns (Zymo, D4065). The proper size of the PCR products was confirmed by agarose gel electrophoresis. The riboprobes were then transcribed using the MAXIscript T7 Transcription Kit (Thermo Fisher Scientific, AM1314). For a 20 µL transcription reaction, 1 μg of PCR template DNA was incubated with 2 µL Biotin RNA Labeling Mix (containing 10 mM each ATP, CTP, GTP, 6.5 mM UTP, and 3.5 mM Biotin-16-UTP, pH 7.5) (Roche, 11685597910), 2 µL 10× transcription buffer, and 2 µL T7 enzyme (30 U). Note that for Figure 5, the amounts of Biotin-16-UTP and UTP used were varied as indicated in the figure, while keeping the total UTP concentration at 10 mM. For the detection of GCC2 and DIS3L, antisense RNA probes to the coding sequence were synthesized as described above using a 3:1 ratio of Biotin-16-UTP to UTP (7.5 mM Biotin-16-UTP and 2.5 mM UTP) for increased sensitivity. The reaction was incubated at 37°C for 15 min. The template DNA was degraded by adding 1 µL (2 U) Turbo DNase (Thermo Fisher Scientific, AM2238) with incubation at 37°C for 10 min.
The RNA was then purified using the RNA Clean & Concentrator-25 Kit (Zymo, R1017) following the manufacturer's instructions, and eluted in 50 µL. The concentration of the RNA was measured by UV absorbance with a NanoDrop Spectrophotometer (Thermo Fisher Scientific), and RNA integrity was visualized by electrophoresis and ethidium staining of RNA separated on a denaturing MOPS formaldehyde agarose gel (described below).
Cell culture and transfection
Human HCT116 cells (ATCC, CCL-247) were cultured in McCoy's 5A modified medium (Thermo Fisher Scientific, 16600082) supplemented with 10% (v/v) fetal bovine serum (Genesee Scientific, 25-514) and antibiotics (100 U/mL penicillin and 100 µg/mL streptomycin, Thermo Fisher Scientific), at 37°C with 5% CO2. HCT116 cells were seeded at 200,000 cells in 2 mL per well in a six-well plate (USA Scientific, CC7682-7506) and, after 24 h, were transfected with the amount of Nluc plasmid indicated in the figures. Cells were transfected using Fugene HD (Promega, E2312), following the method specified by the manufacturer and a ratio of 4 μL of Fugene HD to 1 μg of plasmid DNA. We note that for assays with varying amounts of transfected reporter plasmid, the total amount of transfected DNA was held constant by balancing with a control plasmid, pF5A empty vector. Unless otherwise noted, standard transfection conditions used 3 μg total plasmid DNA containing 0.5 μg Fluc plasmid (pGL 4.13), 1.25 μg of Nluc plasmid, and 1.25 μg of pF5A empty vector. The transfected cells were grown for another 48 h and then RNA was purified for Chemi-Northern analysis.
Drosophila D.mel-2 cells (Invitrogen) were cultured in Sf900III (Thermo Fisher Scientific, 12658-019), supplemented with antibiotics (25 U/mL penicillin and 25 μg/mL streptomycin) (Thermo Fisher Scientific) at 25°C. D.mel-2 cells (2 × 10⁶ in 2 mL per well) were seeded in a six-well plate and transfected with 5 ng pAC5.1 Fluc pA plasmid. Transfection master mixes contained 3 μg total plasmid DNA, Sf900III to 144 μL, and 2 μL of Fugene HD per 1 μg of total plasmid DNA. For experiments wherein the reporter plasmid was titrated, the total amount of transfected DNA was balanced using the control plasmid, pIZ V5 H6 empty vector. The transfected cells were grown for an additional 48 h, then RNA was purified for Chemi-Northern analysis.
Drosophila DL1 cells (also known as S1) were transfected as described above with the following alterations: Cells were cultured in Schneider's Drosophila Media (SDM, Thermo Fisher Scientific, 21720024) supplemented with 1× antibiotic–antimycotic (Thermo Fisher Scientific, 15240062), 1% (v/v) Glutamax (Fisher, 35-050-061), and 10% (v/v) heat-inactivated fetal bovine serum (Genesee, 25-514). Transfections contained 5 ng pAC5.4 Nluc pA plasmid, 5 ng pAC5.1 Fluc pA plasmid, pIZ V5 H6 control plasmid (up to 3 μg total DNA), serum-free SDM media, and 2 μL of Fugene HD per 1 μg of total plasmid DNA.
Purification of cellular RNA
HCT116 cells were harvested by washing twice with phosphate-buffered saline (PBS) pH 7.4 (Thermo Fisher Scientific), followed by trypsinization with TrypLE (Thermo Fisher Scientific) for 5 min, and centrifugation at 500g for 5 min. RNA was purified from the cell pellet using the Maxwell simplyRNA Cells Kit (Promega, AS1390) and Maxwell RSC instrument, following the manufacturer's protocol. For the on-bead DNase digestion, the amount of DNase I (Promega, Z3585) was doubled (10 μL total) to ensure the removal of genomic and plasmid DNA. Purified RNA was eluted in 40 μL of nuclease-free water and quantified using a NanoDrop Spectrophotometer.
Denaturing gel electrophoresis of RNA
RNAs were analyzed by denaturing gel electrophoresis in a chemical fume hood using a 1% (w/v) agarose gel (15 cm × 10 cm) containing 1× MOPS buffer (20 mM 3-[N-Morpholino]propanesulfonic acid hemisodium salt [MOPS] pH 7.0, 5 mM sodium acetate, and 1 mM EDTA) with 1.48% formaldehyde. Typically, 2.5 µg of total cellular RNA per sample was prepared in a final volume of 24 µL containing final concentrations of northern RNA sample buffer (0.04 μg/μL EtBr, 23% formamide, 3% formaldehyde, 4.6 mM MOPS, 1.1 mM sodium acetate, and 0.2 mM EDTA), and northern RNA loading dye (2.1% glycerol, 4.2 mM EDTA, and 0.01% [w/v] of bromophenol blue and xylene cyanol). Note that EtBr was not added to the loading buffer for low amounts of RNA (<200 ng), such as RIP samples, because it can affect the migration of the RNA. Instead, those gels can be stained by soaking with EtBr after electrophoresis. For higher amounts of RNA, EtBr did not appreciably impede electrophoresis, transfer, or hybridization, as previously reported (Zhao et al. 2013). RNA molecular weight markers (Promega, G3191) were included. The RNA samples were heated at 70°C for 10 min before loading the entire volume on the agarose gel. The RNA was separated by gel electrophoresis in 1× MOPS running buffer at 95 V for 1.5 h. The size, integrity, and equivalent loading were assessed by EtBr staining and UV visualization of the rRNA.
Blotting of RNA to membrane
After gel electrophoresis, the RNA was transferred from gel to positively charged nylon membrane (Immobilon-Ny+, Millipore, INYC00010) by downward capillary transfer overnight in 20× SSC buffer containing 3 M NaCl and 300 mM sodium citrate (pH 7.0) (Lichtenstein et al. 1990; Chomczynski and Mackey 1994). Briefly, the northern blot transfer apparatus was assembled with an ∼1-in-high stack of cellulose chromatography paper (Thermo Fisher Scientific, 05-714-4). Two sheets of cellulose chromatography paper were soaked in 20× SSC and added to the top of the stack. The nylon membrane was then soaked in ddH2O for 5 min, followed by 20× SSC for 5 min, and then assembled on the top of the stack. The formaldehyde-agarose gel was carefully placed on top of the membrane using a roller to eliminate any bubbles. Two additional sheets of chromatography paper, soaked in 20× SSC, were added to the top of the gel. A wick of chromatography paper was placed on top with each end submerged in a container holding excess 20× SSC. After transfer, the nylon membrane (i.e., blot) was exposed to UV (120 J/cm2, λ = 254 nm) in a CL-1000 cross-linker (UVP) to cross-link the RNA to the membrane. To detect the RNA marker, its lane was removed from the blot and visualized by staining with 0.25% w/v methylene blue in ddH2O for 5 min, followed by washing in ddH2O until marker bands were clearly visible (10 min).
Probe hybridization
The RNA probes were described above. The following DNA oligonucleotide probes were also tested.
-
β-actin biotinylated DNA oligo probe for human ACTB mRNA
-
5′ biotin-GATGGGGTACTTCAGGGTGAGGATGCCTCTCTTGCTCTGGG
-
7SL biotin DNA oligo probe for human 7SL ncRNA
-
5′ biotin-CTTAGTGCGGACACCCGATCGGCATAGCGCACTACAGCCCAGAAC
-
Dmel 7SL biotin DNA oligo probe for Drosophila 7SL ncRNA
-
5′ biotin-GATTGTGGTCCAACCATATCGGTTGGGCTGATAACGGCAGTCCAC
The blot was transferred to a hybridization bottle and incubated with rotation in 10 mL prewarmed ULTRAhyb Ultrasensitive Hybridization Buffer (Thermo Fisher Scientific, AM8670) at 68°C for 1 h for RNA-based probes, or 10 mL of prewarmed ULTRAhyb-Oligo Hybridization Buffer (Thermo Fisher Scientific, AM8663) at 42°C for 1 h for DNA oligo probes. RNA-based probes were typically hybridized at 50 ng/mL, unless otherwise noted in the figures. For DNA oligo-based probes, 5 nM was used. Hybridization proceeded for 12 or more hours at 68°C (RNA probe) or 42°C (DNA oligo probe) in a rotisserie hybridization oven (Thermo Fisher Scientific).
Chemiluminescent detection
After probe hybridization, the buffer was removed from the bottle and then the blot was washed twice with 2× SSC and 0.1% SDS, and then twice with 0.1× SSC and 0.1% SDS. Each wash was performed at 68°C (RNA probe) or 42°C (DNA oligo probe) using 25 mL of the stated buffer for 15 min each in a rotisserie hybridization oven. The Chemiluminescent Nucleic Acid Detection Module (Thermo Fisher Scientific, 89880) was used to detect the biotinylated probe on the blot with streptavidin–HRP and ECL, using the manufacturer's instructions and supplied reagents. Detection was performed at room temperature. The blot (typically 10 × 10 cm) was first incubated with 16 mL of blocking buffer in a clean tray for 15 min with gentle rocking. The blocking buffer was then decanted. Next, 16 mL of fresh blocking buffer containing 50 μL of streptavidin–HRP was added to the blot, followed by gentle rocking for 15 min. The blot was then washed once with 20 mL of the supplied 1× wash buffer for 5 min with gentle rocking. The blot was then transferred to a new clean tray and washed four more times. The blot was transferred to a new tray containing 20 mL of the supplied equilibration buffer and incubated for 5 min with rocking. During the equilibration, 8 mL of substrate working solution per blot was prepared in a conical tube with equal volumes of the supplied chemi luminol/enhancer solution and stable peroxide solution. The substrate mixture was pipetted into a new tray with the blot placed face down into a pool of the liquid for 5 min without rocking. The blot was wrapped in plastic wrap, placed onto a glass plate, and visualized using a chemiluminescence imaging system (Azure 300 Chemiluminescent Imager, Azure Biosystems), starting at 1 sec exposure for RNA probes and 10 sec exposure for oligo probes. Exposure times were adjusted as needed.
RNA coimmunoprecipitation
HT-PABPC1 RIPs were performed using the HCT116 PABPC1-AID cell line (sC278-C2) provided by Kehui Xiang and David Bartel (method to generate this cell line can be found in Xiang and Bartel 2021). The cells were seeded at 400,000 cells per well in a six-well plate. After 24 h incubation, to deplete endogenous PABPC4 by RNAi, the cells were transfected with 25 nM final concentration of ON-TARGETplus SMARTpool siRNAs (Horizon Discovery) targeting PABPC4. To deplete endogenous PABPC1 by AID, after 24 h, 1 µg/mL of doxycycline (Sigma, D9891) was added to the cells to induce OsTiR expression along with 0.2 mM auxinole (Aobious, AOB8812), an inhibitor of OsTIR1 used to prevent background degradation. After 30 min, the cells were transfected with 1.25 μg of HT-PABPC1 and 1.25 μg of pNLP MCS Nluc reporter plasmid as described above. After 6 h, fresh media containing 1 µg/mL of doxycycline and 0.5 mM indole-3-acetic acid (IAA, Goldbio, I-110-25) were added to the test samples. Two wells were harvested for each RIP analysis. For each sample, 8.3 µL Dynabeads Protein A (Thermo Fisher Scientific, 10001D) were washed three times with 250 µL 1×PBS + 0.1% Tween-20 and incubated in 100 µL 1×PBS + 0.1% Tween-20 + 2 µg PABPC1 antibody overnight (Abcam, ab6125), rotating at 4°C. The next day, the HCT116 cells were collected by centrifugation and lysed by cell disruption in 400 µL of lysis buffer (50 mM Tris-HCl pH 8.0, 500 mM NaCl, 0.5% Triton-X100, 1 mM EDTA, RNase Inhibitor [RNasin, Promega]) with 2× cOmplete Protease Inhibitor Cocktail (Roche, 11836153001). Cell debris was removed by centrifugation at 10,000g for 10 min, and the supernatant was then passed through a 0.45-μm filter at 4000g for 3 min. The protein concentration of the extract was measured using the DC-Lowry assay (Bio-Rad). For each sample, 10 µL of lysate was set aside for the input sample. Next, 300 µg of total protein in 200 µL of lysis buffer was added to the protein A beads and incubated for 2 h with end-over-end rotation at 4°C. The supernatant was removed from the RIP samples and the beads were subsequently washed 6× with 500 µL of lysis buffer without RNasin. Washed beads were suspended in 20 µL, 5 µL of which was reserved for western blot analysis (described below). RNA was purified from the input sample and the remaining beads using the RNA Clean & Concentrator-5 Kit (Zymo, R1013), following the manufacturer's instructions, including the on-bead DNase I digestion. RNA was eluted in a final volume of 10 µL. The entire RIP RNA sample was used for northern blotting, along with 1% of the RNA purified from the input sample. EtBr was not included in the sample loading buffer for gel electrophoresis of the RIP samples.
Analysis and quantitation of Chemi-Northern blots
The Chemi-Northern blots were analyzed using AzureSpot Pro analysis software (Azure Biosystems). Individual lanes were identified automatically and adjusted manually as needed. Band signals were detected using the fixed width set to 50. The background was corrected using the rolling ball method with the radius set to 5%. The background corrected signal intensities (volumes, measured in arbitrary units) from titration experiments were plotted and used to determine the linearity of signal response. For northern blot quantitation of PUM repressive activity, the Nluc and Fluc signal intensities were normalized to their respective loading controls, 7SL ncRNA, on the corresponding blots. For each sample, the normalized Nluc reporter signal was then divided by the normalized Fluc signal, to correct for variation in transfection efficiency. The resulting relative response ratios were then used to calculate the log2 fold change in reporter Nluc activity between the PUM-regulated Nluc 3×PRE reporter and the unregulated PRE mutant reporter, Nluc 3×PREmt. Three biological replicates were performed for each measurement.
For the HT-PABPC1 RIP analysis, the Nluc mRNA signal intensities of the IgG negative controls and RIP samples were normalized to their respective inputs. The fold enrichment of the normalized HT-PABPC1 RIPs relative to the normalized IgG controls was then determined. Three biological replicates were performed for each measurement.
Western blot analysis
For western blotting of RIP samples, proteins were separated by SDS-PAGE on a 4%–20% gradient polyacrylamide gel (Bio-Rad) and transferred to a PVDF membrane (Immobilon-P, Millipore) at 60 V constant for 1.5 h at 4°C. The membrane was then blocked for 1 h in 5% w/v nonfat powdered dry milk, 1×PBS, and 0.1% Tween-20 (PBST) and incubated in HaloTag primary antibody (Promega, G9211) diluted to 1:1000 in PBST overnight at 4°C. The membrane was washed three times for 10 min with PBST and incubated with Anti-Mouse Ig HRP secondary (Mouse TrueBlot, Rockland) diluted 1:10,000 in PBST. The membrane was washed again three times for 10 min with PBST and visualized by ECL using Immobilon Western Chemiluminescent HRP Substrate (Millipore).
ACKNOWLEDGMENTS
We thank Drs. Eric Wagner and Rene Arvola for their feedback and critiques on this manuscript prior to publication. This research was supported by the National Institutes of Health grants 1R01GM145835 and 1R01GM144466 to A.C.G. The content is solely the responsibility of the authors and does not necessarily represent the official views of the National Institutes of Health. E.B.D. was supported by the University of Minnesota's Targets of Cancer Training Program, NIH grant T32 CA009138. K.M.M. was supported by the American Cancer Society Postdoctoral Fellowship 134102-PF-19-128-01-DDC.
Author contributions: K.M.M.: conceptualization, investigation, methodology, visualization, formal analysis, writing, review, editing, and revision. R.P.C.: conceptualization, investigation, methodology, visualization, formal analysis, writing, review, and editing. E.B.D.: investigation, methodology, visualization, formal analysis, review, and editing. A.C.G.: funding acquisition, project administration, supervision, conceptualization, visualization, writing, review, editing, and revision.
Footnotes
-
Article is online at http://www.rnajournal.org/cgi/doi/10.1261/rna.079880.123.
- Received October 24, 2023.
- Accepted January 10, 2024.
This article is distributed exclusively by the RNA Society for the first 12 months after the full-issue publication date (see http://rnajournal.cshlp.org/site/misc/terms.xhtml). After 12 months, it is available under a Creative Commons License (Attribution-NonCommercial 4.0 International), as described at http://creativecommons.org/licenses/by-nc/4.0/.
REFERENCES
MEET THE FIRST AUTHOR

Meet the First Author(s) is an editorial feature within RNA, in which the first author(s) of research-based papers in each issue have the opportunity to introduce themselves and their work to readers of RNA and the RNA research community. Katherine M. McKenney is the first author of this paper, “Chemi-Northern: a versatile chemiluminescent northern blot method for analysis and quantitation of RNA molecules.” Katherine is a research scientist in Dr. Aaron Goldstrohm's laboratory at the University of Minnesota, and her research focuses on elucidating mechanisms of gene regulation by human Pumilio RNA-binding proteins.
What are the major results described in your paper and how do they impact this branch of the field?
This paper provides the RNA research community with an up-to-date and optimized protocol for biotin-labeled northern blotting, a technique we termed “Chemi-Northern.” The increasing cost of radiolabeled nucleotides and associated cumbersome regulatory issues prompted our search for an alternative northern blotting method. We combined modern tools and technologies with classic northern blotting to develop an easy, quick, and affordable means to detect and quantify RNA with excellent sensitivity and reproducibility. After careful optimization, we demonstrated the versatility of Chemi-Northern by detecting endogenous mRNAs, noncoding RNAs, and reporter mRNAs purified from human and Drosophila cells. We anticipate that this improved protocol will be a useful resource for a wide range of researchers.
What led you to study RNA or this aspect of RNA science?
In my graduate career, I was drawn to the field of RNA biology by the compelling RNA research and active RNA center offered by the Ohio State University. I joined the laboratory of Dr. Juan Alfonzo to study the chemical modification of transfer RNA in the pathogenic protist Trypanosoma brucei and contributed to the exciting discovery of a novel tRNA editing and modification pathway in this system. I was intrigued by the fact that even a single modification can have profound effects on the RNA structure or function, impacting translation, and in some cases, the viability of the organism. Overall, my graduate experience imparted a drive to understand how gene expression is controlled and its implications in human diseases, focusing on the posttranscriptional regulation of RNA.
If you were able to give one piece of advice to your younger self, what would that be?
My advice would be to take advantage of any chances to present your research and to network and not be afraid to reach out to others for help with scientific problems or career advice. You never know what opportunities may arise from these interactions.
Are there specific individuals or groups who have influenced your philosophy or approach to science?
I was introduced to science at an early age by my father, a chemical engineer, who would encourage learning experimental design and statistics through fun activities including the physics behind Slinkies and the formulation of propellant for film-canister rockets. This initially sparked my curiosity to understand and discover new biological processes with the ultimate goal of contributing to the advancement of human health. I am incredibly grateful for the exceptional training I received from my teachers and mentors throughout my education. My graduate mentor, Dr. Juan Alfonzo, inspired creative thinking and taught me how to be a tenacious and productive scientist. My graduate committee, Drs. Jane Jackman, Anita Hopper, and Paul Herman fostered valuable discussions and advice on my science and career goals and have continued to support me throughout my scientific career. My postdoctoral advisor, Dr. Aaron Goldstrohm, has bolstered my confidence and independence as a scientist and has been an outstanding example as a team leader.




