


VODKA2: a fast and accurate method to detect non-standard viral genomes from large RNA-seq data sets
- Department of Molecular Microbiology and Center for Women's Infectious Disease Research, Washington University School of Medicine, St. Louis, Missouri 63110, USA
- Corresponding author: clopezzalaquett{at}wustl.edu
-
Handling editor: Mihaela Zavolan
Abstract
During viral replication, viruses carrying an RNA genome produce non-standard viral genomes (nsVGs), including copy-back viral genomes (cbVGs) and deletion viral genomes (delVGs), that play a crucial role in regulating viral replication and pathogenesis. Because of their critical roles in determining the outcome of RNA virus infections, the study of nsVGs has flourished in recent years, exposing a need for bioinformatic tools that can accurately identify them within next-generation sequencing data obtained from infected samples. Here, we present our data analysis pipeline, Viral Opensource DVG Key Algorithm 2 (VODKA2), that is optimized to run on a parallel computing environment for fast and accurate detection of nsVGs from large data sets.
Keywords
INTRODUCTION
RNA viruses contain populations of RNA genomes that include the standard full-length viral genomes as well as truncated and/or rearranged non-standard viral genomes (nsVGs) (Gonzalez Aparicio et al. 2022). Two of the most studied nsVGs are copy-back viral genomes (cbVGs) and internal deletion viral genomes (delVGs). CbVGs are generated when during replication of the viral RNA genome, the polymerase detaches from the template strand and resumes elongation downstream by copying the nascent strand generating viral genomes with complementary ends (Fig. 1A,B; Perrault and Leavitt 1978; Lazzarini et al. 1981; Re et al. 1983; Vignuzzi and Lopez 2019). Internal delVGs have truncations either due to the viral polymerase skipping portions of the genome or the viral genome recombining to eliminate portions of the genome (Fig. 1A,C; Nomoto et al. 1979; Perrault and Semler 1979; Davis et al. 1980; O'Hara et al. 1984; Vignuzzi and Lopez 2019). nsVGs have three well-characterized functions that shape virus infection outcome: interference with standard viral genome replication, immunostimulation, and establishment of viral persistence (Vignuzzi and Lopez 2019). Despite their biological significance, the study of nsVGs has been limited by their vast diversity and the limited presence of unique sequences that differentiate nsVGs from the standard viral genome. Although several bioinformatic tools have been created for the identification of nsVGs from NGS data sets (Routh and Johnson 2014; Timm et al. 2014; Jaworski and Routh 2017; Beauclair et al. 2018; Bosma et al. 2019; Boussier et al. 2020; Olmo-Uceda et al. 2022), we show in this work that these tools are not optimized for the identification of cbVGs and often lead to mistakes in the identity of the reported cbVG species. Furthermore, these tools are not designed to efficiently handle large data sets, leading to lengthy processing times. Therefore, there is a need for bioinformatics approaches that can accurately and efficiently detect and characterize cbVGs from large NGS data sets. Our group previously developed and utilized an algorithm specifically focused on the detection of cbVGs (Sun et al. 2019; Felt et al. 2021, 2022). Here, we present a substantially updated version of this tool, the Viral Opensource DVG Key Algorithm 2 (VODKA2; https://github.com/lopezlab-washu/VODKA2), which is optimized to run on a parallel computing environment for fast and accurate detection of nsVGs.
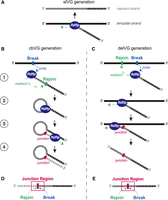
Schematic of the cbVG and delVG generation. (A) Standard viral genome replication by the RNA-dependent RNA polymerase (RdRp). (B) Steps of production of a copy-back viral genome (cbVG) during the replication: (1) During synthesis of the nascent strand, the RdRp releases off the template at the break position, then reattaches on the nascent strand at the rejoin position; (2) the RdRp continues synthesis using the nascent strand as template; (3) the RdRp continues elongating the nascent strand; (4) a cbVG molecule containing complementary ends and loop structure is produced. (C) Steps of production of a deletion viral genome (delVG) during the replication: (1) During synthesis of the nascent strand, the RdRp jumps off the template at the break position, then reattaches on a further upstream position on the template strand; (2) the RdRp continues reading the template strand and (3) keeps elongating the nascent strand; (4) a delVG is produced. (D) Representation of the cbVG where the junction region is highlighted by a red box. Gray/white dashed line represents portion of the sequence that is reverse complementary to the gray/black dashed line portion. (E) Representation of the delVG where the junction region is highlighted by a red box.
RESULTS
VODKA2 detects cbVG junctions from specific regions of the viral genome and quantifies the number of RNA-sequencing reads that contain a cbVG junction with enhanced accuracy. The VODKA2 pipeline has been significantly modified as compared to the previous version. VODKA and VODKA2 workflows are presented in Figure 2 and the major differences are listed in Table 1. Mainly, the general implementation strategy has been optimized to accelerate the analysis as well as increasing its accuracy. A new shell script replaces the original VODKA perl script that was sequentially running each sample through all steps. This wrapper uses LSF scheduler to submit jobs in parallel on a cluster of computing nodes, enabling several samples to be analyzed simultaneously, which is considerably advantageous when running large data sets. Accuracy has been increased mainly by adding a validation step based on Blast. Finally, in order to save time and computing resources, the VODKA2 process is now split into two main tasks (further described in the sections below). First, a catalog must be generated and stored (Fig. 2C) and then, VODKA2 analysis can be performed independently from the first task (Fig. 2D).
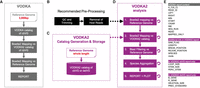
VODKA and VODKA2 workflows. (A) Brief description of the VODKA workflow starting with the DB generation from the last 3 kb of the reference genome to the generation of the report. (B) Preprocessing steps of RNA-sequencing reads to obtain nonhost reads. (C) VODKA2 catalog generation from a full-length reference genome. (D) Brief description of the VODKA2 analysis steps. Dashed arrows represent flow of information coming from the independent process of the VODKA2 analysis. Loop arrows show steps that run in parallel with LSF. (E) Content of the tabulated report. Information under the gray header is generated by both versions of the pipeline. The pink headers show additional information in the new VODKA2 version.
Summary of VODKA2 optimizations
VODKA2 non-standard viral genome catalog
A catalog of all potential nsVG junctions is created based on a reference standard viral genome selected by the user. A nsVG junction is defined as the connected nucleotides where the viral polymerase breaks from the viral genome and then subsequently rejoins at either the nascent strand (copy-back genomes) or further downstream from the template (deletion genomes) to generate a continuous break/rejoin sequence (Fig. 3). The assumptions taken by the VODKA2 catalog generation algorithm are based on the replication process of negative-sense RNA viruses and the fact that the vast majority, if not all, cbVGs are generated when the polymerase starts copying the 3′ end of the antigenome (Fig. 1). Therefore, VODKA2 catalogs are generated by systematically “walking” through the genome from the 3′ end toward the 5′ end and listing all possible combinations of break and rejoin. Another assumption made by the algorithm is that when the polymerase jumps from the template strand, it must reattach to its nascent strand to generate a product that can be called cbVG (Fig. 1). Therefore, the position of the break point must be upstream of the rejoin point. This condition results in the assumption that any recombinant with a break detected at a further position from the rejoin is considered a cbVG by the algorithm. For delVG, the only assumption is that the “jump” skips at least one nucleotide. These catalogs are specific for each genome, so a new catalog needs to be created for each new genome.
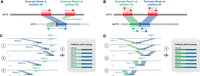
VODKA2 catalog generation process. (A) Example of a single iteration for a copy-back viral genome (cbVG) junction region sequence generation. The gray and red line represents the reference sequence of an imaginary standard viral genome (stVG) used to extract 5 nt downstream from break (CTCTA) and the reverse complement of the 5 nt downstream from rejoin (AACCG) to generate the corresponding cbVG junction sequence (CGGTTCTCTA). The cbVG hypothetical sequence is shown in lighter gray and the dashed lines represent the two complementary ends. Arrows above and underneath the sequence portions show the orientation of the extracted sequences. (C) The VODKA2 cbVG catalog generation algorithm proceeds as follows: (1) Identify all possible Break positions that could rejoin at Rejoin r1; (2) next, identify all possible Break positions that could rejoin at Rejoin r2; (3) next, identify all possible Break positions that could rejoin at Rejoin r3 and continue for all possible combinations; (4) write the junction reference sequences to a file in FASTA format. (B) Example of a single iteration for a deletion genome (delVG) junction region sequence generation. The gray and red line represents the reference sequence of an imaginary standard viral genome (stVG) used to extract 5 nt downstream from break (AACCG) and the 5 nt upstream of rejoin (CTCTA) to generate the corresponding delVG junction sequence (CTCTAAACCG). The delVG hypothetical sequence is shown in lighter gray. Sequence orientation of the two extracted sequence portions must be in the same orientation, which can be either both forward or both reverse as shown by the arrows. (D) The VODKA2 delVG catalog generation algorithm proceeds as follows: (1) Identify all possible Rejoin positions that could break at Break b1; (2) next, identify all possible Rejoin positions that could break at Break b2; (3) next, identify all possible Rejoin positions that could break at Break b3 and continue for all possible combinations; (4) write to a file the junction reference sequences as they are generated (in FASTA format).
To generate the catalog of all potential cbVG or delVG junction regions, all possible combinations of break and rejoin positions together with N nucleotides upstream of break and downstream from rejoin are first extracted from the reference genome (N should be at least equal to the sequencing read size of the data set to be analyzed). The sequence downstream from rejoin is reverse complemented for cbVG junction sequences (region shown in dashed green in Fig. 3A) or are maintained for delVG junction sequences (region shown in green in Fig. 3B) before being concatenated with the sequence upstream of break (region shown in blue in Fig. 3A,B). Further descriptions of the generation of the nsVG junction regions are detailed in the Supplemental Figure 1. The theoretical nsVG junction sequences have a length of 2*N, allowing for full mapping of potential nsVG junction reads during step 2 described next.
The junction region sequences are written to a large multi-FASTA file as they are generated, then a Bowtie2 index is built and stored for subsequent use of this “VODKA2 catalog” during VODKA2 analysis. The generation of a VODKA2 catalog prior to the VODKA2 analysis enables considerable computational resource saving during the analysis of samples. However, the junction regions multi-FASTA file indexing with Bowtie2 (more specifically Bowtie2-build) can be memory consuming. We provided estimations of the amount of memory and disk space required by Bowtie2-build according to the size of the reference genome in Supplemental Table 1.
VODKA2 analysis process overview
Before running sequencing samples through VODKA2, we recommend trimming sequencing adapters and removing host reads from the raw sequencing data (see Fig. 2B). Reads corresponding to any known coinfecting virus or contaminant organism can also be removed to reduce the size of input data, hence increasing the speed of analysis. Panel D of Figure 2 describes the updated VODKA2 analysis pipeline that proceeds as follows:
Mapping reads to the standard viral genome with Bowtie2
VODKA2 initiates by eliminating any viral read that aligns perfectly with the standard viral genome (using Bowtie2 with default parameters, version 2.4.1 was used for all analysis presented in this work). These preliminary filters help in reducing the data volume and minimizing false positives, as some host and viral sequences could be mistakenly identified as non-standard viral genome (nsVG) junctions.
Mapping reads to nsVG catalog with Bowtie2
Mapping against the VODKA2 nsVG catalog, which is the key step of our method, is performed with Bowtie2 set to lenient settings (option -mp 0,0) in order to minimize mismatch penalties due to viral mutations (e.g., nucleotide substitutions, insertions, and/or deletions). We designed the algorithm to report any read that would match exactly 30 nt around the junction (15 on each side), but any mismatch outside of that region is allowed in order to maximize the chances of detecting all nsVG junctions reads and avoid false negatives. We based these parameters on the fact that 15 is the shortest kmer size with a unique occurrence within a viral genome (Zhang et al. 2017). This approach assures high nsVG detection sensitivity and generates a comprehensive preliminary list of possible reads mapped to nsVG junctions for each data set.
Filtering possible junction reads with BLAST
To ensure that no false positive reads are part of the output, VODKA2 runs an additional BLAST alignment of all possible nsVG reads from step 2 against the viral reference genome. Any potential nsVG read that does not meet the following criteria is discarded: (i) the read must match exactly two separate regions of the reference viral genome (reported as “alignment ranges” in BLAST output). Sequences mapped to the VODKA2 catalog during step 2 but showing ambiguous BLAST alignment (more than two ranges) are removed. (ii) The break/rejoin positions shown by the two BLAST ranges must be consistent with step 2 output (i.e., within 5 nt). (iii) The last requirement is nsVG subtype specific. For delVGs, the two ranges must map to the same strand of the viral genome. For cbVGs, the two ranges must match opposite strands of the genome. Upon fulfillment of the three requirements, the read is designated as a true nsVG junction read.
NsVG species aggregation
Among the confirmed nsVG reads, some nsVG junctions share similar sequences, but the reported break/rejoin junction is shifted to a nearby position. This shift often occurs if the break/rejoin junction contains identical sequences flanking the break and rejoin positions. NsVG reads can be mapped to any position within these sequences. This is a known reported phenomenon (Routh and Johnson 2014; Beauclair et al. 2018) and can potentially bias quantification of nsVGs junction reads. To provide more accurate nsVG read counts at these shifted junctions, similar reads are grouped into nsVG “species” based on two criteria: (i) the predicted nsVG size that is calculated based on the junction break and rejoin positions in the reference genome must be identical for all nsVG reads within the same group, (ii) break position shifts must be of 5 nucleotides or less. A new “Species_ID” is then generated to represent each group of similar nsVG reads. The Species_ID is called as the most represented break (and its corresponding rejoin) in the group (Supplemental Fig. 2). While this aggregation process provides a more accurate representation and quantification of nsVG junctions present in a sample, the aggregation settings can be altered depending on the question asked.
Output table and visualizations
VODKA2 provides abundant output data for the detected nsVG species (Fig. 2E). For both cbVGs and delVGs, the output file includes the read ID, the sequence of the read, the break point, the rejoin point, the strandedness of the read (SAM flag), the predicted size of the nsVG and the aggregated Species_ID. For cbVGs only, the output file also includes the theoretical length of the cbVG loops and stems. For delVGs only, the output file includes the deletion size, the viral gene where the break occurs, and the viral gene where the rejoin occurs. Using this output, multiple types of analyses can be performed to study the abundance and diversity of cbVGs and delVGs.
VODKA2 detects simulated cbVGs with high accuracy
In order to assess the accuracy of VODKA2 in detecting cbVGs, we performed a comparative analysis against state-of-the-art methodologies. We created 10 artificial cbVG sequences in silico, based on the respiratory syncytial virus (RSV) G gene (KC731482.1); these are detailed in Table 2. This gene contains a 72 nt repetition within its sequence, posing an additional challenge for the detection of nsVGs as it is expected to impact sequence alignments. The simulated sample was aligned against the RSV G gene reference sequence (KC731482.1) and the nonviral reads were then analyzed with VODKA2, VODKA, ViReMa (Sotcheff et al. 2023), and DI-tector (Beauclair et al. 2018) (Fig. 4A). VODKA2 and DI-tector detected all of the artificial cbVG junction regions without generating any false positives (Table 2; Fig. 4A). VODKA and ViReMa also detected all of the artificial cbVGs but in addition reported at least one false positive species. However, the Break/Rejoin positions of the cbVG junctions reported by both ViReMa and DI-tector (respectively referred to as Donor/Acceptor sites and Breakpoint/Reinitiation sites) were incorrect and can mislead the user. As shown in Figure 4A, the Break and Rejoin positions of the cbVG species seem to be systematically inverted by both tools. In the case of ViReMA, this can be explained by the fact that the software was originally designed to detect recombinations between donor and acceptor genomes of the same orientation. Hence, any recombination event between a positive and a negative strand and vice versa is called a copy-back, without clearly identifying which of the donor or acceptor sites is the break (or rejoin) position of a cbVG (Sotcheff et al. 2023). Regarding DI-tector, although it also seems to be biased to the opposite sense, eight cbVG species out of 10 are reported in both orientations. This phenomenon has already been observed and reported by the authors of DI-tector and suspected to be false positives (Beauclair et al. 2018). The VODKA2 approach presents the advantage of avoiding such ambiguous reporting as the prebuilt catalog will constrain the putative cbVG to a specific orientation. In other terms, the Break and Rejoin reported by VODKA2 are controlled by the cbVG reference sequences and cannot be distorted by a misinterpretation of the sequencing reads orientation.
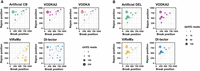
Detection of simulated cbVG and delVG reads. (A,B) Representation of (A) cbVG and (B) delVG break and rejoin points reported by VODKA2 (pink), VODKA (gray: cbVG only), ViReMa (yellow), and DI-tector (blue). Expected results are shown in green. Size of dots is dependent on the number of detected reads at each break/rejoin junction. False positive reads are shown in red.
Simulation of RSV G copy-back and deletion sequences
VODKA2 can detect delVGs
In addition to cbVGs, it is possible to use VODKA2 to detect deletions by generating a catalog of all putative delVGs of the specified reference genome. To illustrate this new feature, we analyzed 10 artificial delVGs based on the RSV G gene. Similar to the results obtained with the simulated cbVG data, all expected delVG species were correctly identified, showing again the specificity of this method. Observably, VODKA2 reported slightly fewer reads than DI-tector and ViReMA for some particular cbVG and delVG species (Table 2; Fig 4B), and it is unclear at the moment what is the cause of this.
VODKA2 detects cbVGs from NGS data with high accuracy and efficiency
With the goal of demonstrating the cbVGs detection efficiency of VODKA2 in real RNA-seq data, we analyzed data from a sample of cells infected in vitro with Sendai virus (SeV), which is a paramyxovirus of 15,384 nt that is known to produce a single major cbVG species of length 546 nt (Sun et al. 2019), with the Break and Rejoin occurring around positions 14,930 and 15,290 of the reference genome (Fig. 5A). VODKA2 reported 7138 validated cbVG junction reads, all having a Break and Rejoin around the expected positions for cbVG 546. ViReMa and DI-tector results also confirmed the presence of this major species but both algorithms also reported at least one false positive junction and required significantly increased running time compared to VODKA2, which processed the sequencing sample almost 10 times faster. This comparison demonstrates the advantage of VODKA2 to quickly and reliably detect cbVGs in large data sets (Fig. 5).
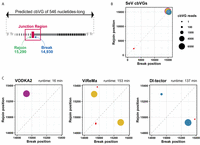
Detection of cbVG reads in SeV. (A) Representation of the break and rejoin positions of cbVG 546. (B,C) Representation of cbVG break and rejoin points reported by VODKA2 (pink), ViReMa (yellow), and DI-tector (blue). Size of each point is dependent on the number of detected reads at each break/rejoin species. (B) Overlay of all cbVGs detected across the whole genome by the three types of software. Red dots indicate false positives from DI-tector. (C) Zoom-in of species detected within positions 14,800 and 15,384 of the reference genome for each software. False positive reads are shown in red. Processing time of each software is shown in minutes.
DISCUSSION
It has become clear over the past decade that nsVGs play a crucial role in virus pathogenesis (Vasilijevic et al. 2017; Vignuzzi and Lopez 2019; Felt et al. 2021; Penn et al. 2022; Zhou et al. 2022). As a consequence, there has been a big push in the nsVG field to develop NGS/bioinformatics approaches that are more sensitive, less biased, and more accurate, such as DI-tector (Beauclair et al. 2018), DVG-Profiler (Bosma et al. 2019), DG-Seq (Boussier et al. 2020), ViReMa (Routh and Johnson 2014; Jaworski and Routh 2017; Sotcheff et al. 2023), and DVGfinder (Olmo-Uceda et al. 2022). Our own group has previously developed a pipeline, VODKA, which is the first tool focusing on the detection of cbVGs within NGS (Sun et al. 2019). We have updated and improved this pipeline, now called VODKA2, to detect not only cbVGs but also delVGs in a time effective manner.
The development of NGS technologies offers the capacity of deeper sequencing and increasing amounts of samples within a single experiment, which raises the need for improving the running speed of bioinformatics tools for more efficient analysis of large data sets. We achieved that goal in VODKA2 and considerably accelerated the analysis process of each sample by separating the nsVG catalog generation step. A catalog is generated only once for each reference genome and remains available for any further sample analysis, saving precious processing time when running larger data sets. Moreover, contrary to other common methods such as ViReMa and DI-tector, the VODKA2 catalog offers the benefit of calling nsVG junctions after running a single alignment step, without having to split and realign unmapped sequences multiple times. Furthermore, we designed VODKA2 to easily run several samples in parallel by using a job scheduler when available, offering the possibility to effectively run large-scale projects.
During the process of optimizing VODKA for the analysis of clinical samples, we observed that there were not only false positive cbVG junction reads reported by the original algorithm, but also some false negatives. We identified that VODKA was failing to report these reads due to higher levels of dissimilarities in the sequence compared to other reads matching the same regions. This could be due to the accumulation of mutations, or to a lower quality of sequencing. We found that these reads would still pass our stringent filtering step based on Blast alignments, had they not been discarded during the first alignment step of VODKA. Increasing the leniency of this first step in VODKA2, by running Bowtie2 with option ‐‐mp 0,0 to minimize the penalty scores for mismatches or gaps, allows such reads to make it to the new Blast filtering step and be reported as nsVGs. Of note, other splice/read aligners, such as segemehl (Otto et al. 2014), HISAT (Kim et al. 2015), or STAR (Dobin et al. 2013) may help optimize VODKA2 for specific applications and will be considered in future updates of the pipeline. In this work, we focused on artificial sequencing data from the RSV gene G and Sendai virus infection with the purpose of showing VODKA2 accuracy, and Bowtie2 default options should allow for the same results. However, our goal is to provide the community with an alternative method for the discovery and characterization of nsVGs from various viruses and data sets, therefore VODKA2 still has to be reliable when working for example with highly mutating viruses or clinical samples for which the exact reference genome is not available. We are aware that some of the standard viral genome reads may not be detected depending on the accuracy of the reference genome, as VODKA2 is not focusing on standard viral reads.
Another strong advantage of the VODKA2 nsVG catalog approach is the control of cbVG orientation by unambiguously identifying the Break and Rejoin positions, whereas both ViReMa and DI-tector report information that can be confusing for the user, unless running further analysis of each reported junction read to identify the correct sense. Yet, as cbVGs have been shown to be produced only during replication of negative-sense RNA viruses, VODKA2 focuses by default on the cbVGs generated from the 3′ ends of the provided reference genome. If looking to detect cbVGs generated from the opposite end, for example, when working with a positive-sense RNA virus, we suggest using the reverse sequence of the reference genome to generate the cbVG catalog and running the analysis.
VODKA2 can analyze large NGS data sets and generates accurate and detailed outputs for further analysis of cbVGs and delVGs. Long-read sequencing technologies such as ONT or PacBio represent a promising type of data for the characterization of full-length sequences of nsVGs, because we can detect a full sequence, as opposed to the predictions made with short-read sequencing. Indeed, it is only possible to predict lengths of nsVGs from short-read data based on the identified break and rejoin points and the known length of the standard reference genome. Unfortunately, the VODKA2 approach, being specific to short-read sequencing data, would not be able to take advantage of the potential provided by long-reads. Such data would require a different methodology for analysis, assumably based on direct alignment without the need for creating nsVG junction catalogs. We hope that the knowledge currently building using short-read data analysis with tools like VODKA2 would be beneficial for the development and validation of new methods based on long-read sequencing.
We show that the new filtering process reduces the risk of detecting false positives, increasing the specificity of VODKA2. Although we observed a slight decrease of VODKA2 sensitivity as compared to ViReMa and DI-tector, that is with the benefit of a 10 times fold increase of speed. Taken together, VODKA2 is a valuable tool for the fast detection of nsVG species providing data that set the stage for understanding better the biology of nsVG among different RNA virus populations in large-scale studies.
MATERIALS AND METHODS
Simulated nsVG sequencing data
We used the RSV reference genome (KC731482.1) and generated random numbers from a range of 15 to 951 to create artificial copy-back and deletion sequences from gene G. NovaSeq 150 bp paired-end reads were simulated using InSilicoSeq v1.5.3 with default parameters and random coverage values (Gourle et al. 2019).
RNA-seq data preprocessing
Raw sequencing reads were trimmed of Illumina adaptors using Cutadapt (v2.5) and analyzed by FastQC (v0.11) to ensure quality of sequencing reads. The reads mapping the human genome (GRCh38) were removed from the data sets using Bowtie2 (v2.4.1).
nsVG detection with VODKA2
VODKA2 is freely available in GitHub (https://github.com/lopezlab-washu/VODKA2). VODKA2 nsVG catalogs were created using VODKA2 genome_to_new_fasta step with read size set to 150 bp. We used the whole viral reference genome size for all catalogs: 966 nt from the RSV gene G reference sequence were used to generate the cbVG and delVG catalogs. With Sendai virus being much larger, we used 400 GB RAM memory to generate cbVG and delVG catalogs from the whole reference genome (15,384). The output of this step is a multi FASTA file containing all theoretical junction region sequences, which was then indexed for Bowtie2 (using Bowtie2-build v2.4.1).
VODKA2 analysis was performed according to the recommendations on GitHub. VODKA2, ViReMa, and DI-tector analyses were run using either 10 GB for the simulated nsVG data or 150 GB for the SeV infected sample. All scatterplots shown in this work were generated using the VODKA2 script VODKA2_species_plot.R using R v4.3.0.
Cell line and virus
A549 cells (human type II pneumocytes cells, ATCC CCL-185) were cultured at 37°C with 5% CO2 with Dulbecco's modified Eagle's medium (DMEM; Invitrogen) supplemented with 10% fetal bovine serum (FBS), 50 ng/mL gentamicin (Thermo Fisher), 2 mM l-glutamine (Invitrogen), and 1 mM sodium pyruvate (Invitrogen). A549 cells were treated with mycoplasma removal agent (MP Biomedicals, 093050044) and routinely tested for mycoplasma before use. Sendai Cantell (SeV) strain was grown in 10-d-old, embryonated chicken eggs (Charles River) for 40 h as previously described (Yount et al. 2006).
Virus infection
A549 cells were washed twice with PBS. Subsequently, the cells were exposed to SeV virus in an infectious medium, with a multiplicity of infection (MOI) of 1.5. The infectious medium consisted of DMEM supplemented with 35% bovine serum albumin (BSA; Sigma Aldrich), penicillin–streptomycin (Invitrogen), and 5% NaHCO3 (Sigma Aldrich). The virus and cells were incubated together at 37°C for 1.5 h. Following the incubation period, an additional infectious medium was provided to the cells. As a control, mock conditions underwent the same media change procedure but without the addition of the virus. Infected and mock cells were incubated at 37°C and 5% CO2 for 16 h. Supernatants were collected of cells and RNA was extracted by TRIzol/chloroform extraction (Thermo Fisher, 15596018).
RNA-sequencing
Total RNA was extracted from mock and infected cells using TRIzol reagent (Life Technologies). The concentration of the extracted RNA was measured using a Thermo Scientific NanoDrop spectrophotometer. RNA quality was assessed using an Agilent TapeStation or Bioanalyzer (Agilent Technologies) prior to cDNA library preparation. All samples were prepared using the Illumina TruSeq Stranded Total RNA Library Prep Kit with Ribo-Zero Gold. SeV samples were run on an Illumina NextSeq 500 to generate 150 bp, paired-end reads, resulting in ∼41 million reads per sample. SeV samples were run on NextSeq 550 to generate 150 bp, paired-end reads, resulting in ∼ 64 to 91 million reads per samples. Average phred quality score of samples was ∼34.
DATA DEPOSITION
Raw sequencing data of Sendai Cantell infection (used in Fig. 5) are available in SRA under accession number PRJNA1014192.
SUPPLEMENTAL MATERIAL
Supplemental material is available for this article.
ACKNOWLEDGMENTS
We want to thank Gregory R. Grant and Eun Ji Kim for the initial VODKA. This work was supported by the National Institutes of Health, National Institute of Allergy and Infectious Diseases AI137062 and AI134862 to C.L.B., T32-007317 to M.H., and NSF-GRFP DGE2139839 to N.S.R..
Footnotes
-
Article is online at http://www.rnajournal.org/cgi/doi/10.1261/rna.079747.123.
-
Freely available online through the RNA Open Access option.
- Received June 15, 2023.
- Accepted October 12, 2023.
This article, published in RNA, is available under a Creative Commons License (Attribution-NonCommercial 4.0 International), as described at http://creativecommons.org/licenses/by-nc/4.0/.




