


High-throughput imaging of mRNA at the single-cell level in human primary immune cells
- Manasi Gadkari1,5,
- Jing Sun2,5,
- Adrian Carcamo3,
- Hugh Alessi1,
- Zonghui Hu4,
- Iain D.C. Fraser2,
- Gianluca Pegoraro3 and
- Luis M. Franco1
- 1Functional Immunogenomics Section, Systemic Autoimmunity Branch, National Institute of Arthritis and Musculoskeletal and Skin Diseases, National Institutes of Health, Bethesda, Maryland 20892, USA
- 2Laboratory of Immune System Biology, National Institute of Allergy and Infectious Diseases, National Institutes of Health, Bethesda, Maryland 20892, USA
- 3High-Throughput Imaging Facility (HiTIF), National Cancer Institute, National Institutes of Health, Bethesda, Maryland 20892, USA
- 4Biostatistics Research Branch, National Institute of Allergy and Infectious Diseases, National Institutes of Health, Rockville, Maryland 20852, USA
- Corresponding authors: luis.franco{at}nih.gov, gianluca.pegoraro{at}nih.gov
-
↵5 These authors contributed equally to this work.
Abstract
Measurement of gene expression at the single-cell level has advanced the study of transcriptional regulation programs in healthy and disease states. In particular, single-cell approaches have shed light on the high level of transcriptional heterogeneity of individual cells, both at baseline and in response to experimental or environmental perturbations. We have developed a method for high-content imaging (HCI)-based quantification of relative changes in transcript abundance at the single-cell level in human primary immune cells and have validated its performance under multiple experimental conditions to demonstrate its general applicability. This method, named hcHCR, combines the sensitivity of the hybridization chain reaction (HCR) for the visualization of RNA in single cells, with the speed, scalability, and reproducibility of HCI. We first tested eight cell attachment substrates for short-term culture of primary human B cells, T cells, monocytes, or neutrophils. We then miniaturized HCR in 384-well format and documented the ability of the method to detect changes in transcript abundance at the single-cell level in thousands of cells for each experimental condition by HCI. Furthermore, we demonstrated the feasibility of multiplexing gene expression measurements by simultaneously assaying the abundance of three transcripts per cell at baseline and in response to an experimental stimulus. Finally, we tested the robustness of the assay to technical and biological variation. We anticipate that hcHCR will be suitable for low- to medium-throughput chemical or functional genomics screens in primary human cells, with the possibility of performing screens on cells obtained from patients with a specific disease.
Keywords
INTRODUCTION
Gene expression assays are the cornerstone of functional genomics. Measurement of transcript abundance is central to our current understanding of cell biology, defining the basal state of different cell types as well as their response to environmental or experimental perturbations. In recent years, the emphasis has been on the analysis of gene expression at the single-cell level. In the case of immune cells, this has shed light on the heterogeneity of the transcriptional state of individual cells and has led to the identification of transcriptional subsets among what were previously thought to be homogeneous populations (Stubbington et al. 2017). It has also advanced our understanding of the sets of functionally related and coregulated genes that govern the response to stimuli by individual cells (Pope and Medzhitov 2018). Immune cell heterogeneity and transcriptional regulation at the level of individual cells are especially relevant at a time when the development of cancer immunotherapy has accelerated (Gibellini et al. 2020), the effects of immunosuppressive drugs are being revealed to be highly cell type-dependent (Franco et al. 2019), and a rapidly growing arsenal of new drugs targeting specific components of immune signaling networks is being developed (Tiligada et al. 2015). In this context, assays that are capable of measuring changes in gene expression at the single-cell level, with high-throughput and ideally in primary cells, are needed. These could be used in chemical or functional genomic screens to systematically identify molecular mechanisms, which could then be prioritized for further downstream characterization.
The improved ability to study gene expression at the level of individual cells has been driven by technological advances that have moved the experimental toolkit in opposite but complementary directions: one with greater breadth (simultaneous measurement of thousands of transcripts per cell, with low sensitivity) and the other with greater depth (high-sensitivity measurements of one or a few genes per cell). Greater breadth has been achieved by advances in single-cell transcriptomics. Single-cell RNA sequencing (scRNA-seq) allows simultaneous gene expression measurements of hundreds to thousands of genes per cell (Hwang et al. 2018) and has become the method of choice for identifying transcriptional subsets of cells. The high cost per sample and limited scalability have so far limited the use of scRNA-seq to low-throughput applications. In addition, current scRNA-seq technologies rely on a superficial sampling of each cell's transcriptome, making the sensitivity of detection of a transcript in any given cell low and biasing the representation toward more highly expressed genes (Chen et al. 2019). Greater depth has been achieved by concomitant advances in single-molecule RNA fluorescence in situ hybridization (smFISH) methods, which have greatly increased the sensitivity of detection of individual RNA molecules (Femino et al. 1998; Raj et al. 2008; Pichon et al. 2018). The higher sensitivity of RNA smFISH enables the quantitative detection of single transcripts in intact cells. On the other hand, quantitative detection of single molecules of mRNA with smFISH is dependent on high spatial resolution and the use of Nyquist sampling criteria, which require the use of high magnification objectives, large z-stacks of images, and single-plane image analysis. Unfortunately, the need of these criteria for precise single-molecule quantification precludes the application of smRNA FISH in a high-throughput format for chemical or functional genetics screens, where thousands of perturbations, and thousands of cells per condition, are tested in a single experiment.
We decided to use a high-content imaging (HCI) approach to measure relative differences in RNA transcripts in a medium- to high-throughput format. HCI uses automated liquid handling, image acquisition, and image analysis, to measure changes between a baseline condition and hundreds to tens of thousands of test conditions (Pegoraro and Misteli 2017; Esner et al. 2018). For these reasons, it is particularly suitable for medium- or high-throughput screening experiments aimed at understanding the cellular effects of large collections of perturbing agents like chemical compounds, RNAi, or CRISPR/Cas9. Such screening experiments are a central component of drug development pipelines (Hughes et al. 2011) and are a powerful tool for dissecting signaling networks in biological systems by selective manipulation of individual components (Sun et al. 2016).
Most HCI assays to date have relied on the detection of signals from fluorescent dyes, stably expressed fluorescent proteins, or fluorescently labeled antibodies directed against endogenous proteins of interest. However, the same principles can be applied to high-throughput imaging of RNA (Querido et al. 2017).
HCI assays have also relied primarily on immortalized and/or transformed cancer cell lines, which are easier to grow and manipulate than primary cells, but also tend to have substantial structural genomic abnormalities, which can limit the generalization of the results of transcript-level assays obtained in these cells to more physiologically relevant systems (Mittelman and Wilson 2013; Gioia et al. 2018; Zhou et al. 2019). In addition, cell lines can have different responses to chemical stimuli when compared to primary cells or cells exposed in vivo (Lavrentieva 2018). Finally, human cell lines are often derived from a single individual, which limits the generalizability of the results as they cannot account for biological, inter-individual variation. Screening assays based on primary human cells would overcome these issues and would also allow for personalized screens with cells obtained directly from specific patients, or from groups of patients with a particular disease of interest (Lavrentieva 2018). However, their culture is more technically challenging due to cell-to-cell heterogeneity, variable attachment properties, and low proliferation capacity (Hauser 2015; Lavrentieva 2018).
To address these limitations, we have developed an imaging-based high-throughput method for measuring changes in gene expression at the single-cell level in primary human cells in a 384-well format. This method, which we abbreviate as hcHCR, combines HCI with a recently developed isothermal signal amplification method for RNA FISH known as the hybridization chain reaction (HCR) (Choi et al. 2010, 2018), which enables the use of lower magnification objectives, thus allowing imaging larger fields of view containing hundreds of cells per field, a property necessary for high-throughput screening applications. To demonstrate the general applicability of hcHCR, we have validated its performance on technical and biological replicate experiments with different human primary immune cell types and under multiple experimental conditions.
RESULTS
The hcHCR workflow
The assay workflow for hcHCR is summarized in Figure 1. Primary cells from human peripheral blood are first isolated and plated with cell culture media in 384-well imaging plates (Fig. 1A). After a rest period, intended to allow stabilization of gene expression after plating, the cells are treated, simultaneously or in tandem, with one or more chemical or biological perturbing agents whose effect on gene expression is being tested. Treated cells are then fixed and RNA is hybridized in situ with sequence-specific oligo DNA probe sets carrying HCR initiator sequences, followed by HCR amplification and automated image acquisition (Fig. 1A; Choi et al. 2010, 2018). High-Content Image analysis is then used to first segment nuclei based on the DAPI image, followed by dilation of a mask to cover the cell body (cell segmentation), and by HCR spot detection and counting (Fig. 1B). The relative abundance of up to three specific mRNA transcripts can be quantified at the single-cell level in up to thousands of wells on a commercial HCI instrument. HCR spot counts per cell serve as a proxy measurement for gene expression levels; this measurement modality has been referred to as “digital HCR” (Choi et al. 2018). Importantly, since our image acquisition and analysis conditions were optimized to allow for high-throughput applications and not for single RNA molecule sensitivity as in traditional smFISH applications, hcHCR allows for relative but not absolute measurements of mRNA abundance. The relative abundance measurements produced by hcHCR can be visualized and contrasted by multiple methods, and the image output of an hcHCR experiment can be converted to the FCS format for visualization and gating with standard flow cytometry software (Fig. 1C).
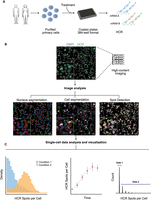
Overview of hcHCR. (A) Human primary cells are purified and plated in 384-well imaging plates, followed by in vitro treatment, RNA HCR, and high-content quantitative imaging at single-cell resolution. (B) Representative high-content image analysis of hcHCR data: segmented nuclei regions, cell body regions, and HCR spot borders are shown in pseudocolors. Magnification: 60×. Scale bar for full FOV: 20 microns. Scale bar for inset: 10 microns. (C) Analysis and visualization of hcHCR data. (Left) A representative single-cell density plot, comparing the distribution of HCR spots per cell between two conditions. (Center) A representative display of the mean and SEM for HCR spots per cell over time. (Right) High-throughput HCR data can be analyzed and gated with standard flow cytometry software. A representative histogram of cell counts by HCR spots per cell, with two gates, is shown.
Identification of appropriate substrates for HCI of human primary immune cells
Fluorescence microscopy acquisition is greatly facilitated by the attachment of cells to the bottom of imaging plates. With this goal in mind, we began by comparing the adherence of four lymphoid or myeloid human primary immune cell types, which normally grow in suspension, to different substrates in 384-well imaging plates. Purified B cells, monocytes, neutrophils, or CD4+ T cells were plated live in wells coated with one of eight substrates: MS-1, MS-2, MS-3, 3D Hydrogel, PDL, SPA, 3D Hydrogel PDL, or 3D Hydrogel SPA. After a refractory period of 2 to 4 h to allow for adherence to the substrate and stabilization of gene expression after plating, cells were fixed. Culture plates were then subject to the same incubation conditions and washes that would normally be used in our hcHCR protocol, but without the addition of HCR probes or hairpins (see Materials and Methods). Cell nuclei were then stained with DAPI and cell attachment was quantified by HCI (Fig. 2A).
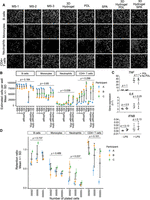
Identification of an appropriate substrate for HCI of human primary immune cells. Four human primary immune cell types (B cells, monocytes, neutrophils, and CD4+ T cells) were independently cultured in 384-well plates in which well bottoms were coated with one of eight substrates: MS-1, MS-2, MS-3, 3D Hydrogel, PDL, SPA, 3D Hydrogel PDL, or 3D Hydrogel SPA. Each cell type was plated at three concentrations: 100,000, 50,000, or 25,000 cells/well. (A) Representative images of each cell type and substrate at a concentration of 100,000 cells/well. Cells were fixed with 4% PFA and stained with DAPI prior to imaging. Magnification: 60×. Scale bars: 20 microns. (B) Cell attachment for four human primary immune cells in the eight substrates shown in A. Cells were plated at 100,000 cells/well. The y-axis represents the number of cells counted after fixation and automated liquid handling in conditions similar to those of the hcHCR protocol. Each dot represents one biological replicate (one unrelated healthy human donor). Colored points and error bars display the mean ± SD for three technical replicates of each biological replicate. Black error bars display the mean ± SD of the biological replicates. Significance values are from a linear mixed-effects model. (C) TNF, IL6, and IFNB expression in primary human monocytes cultured in the presence or absence of PDL substrate. Cells were plated at 100,000 cells/well. LPS stimulation was used as a positive control. Gene expression was measured by qPCR. Each data point represents one biological replicate. Error bars display the mean ± SD. Significance values are for a Wilcoxon signed-rank test. (D) Retention ratios for four primary human immune cells at three cell concentrations. Cells were plated in PDL substrate and underwent fixation and automated liquid handling in conditions similar to those of the hcHCR protocol. The retention ratio for each biological replicate was calculated as the estimated number of cells per well [(number of cells counted)/(number of fields of view imaged) × (total number of fields of view per well)] divided by the number of cells plated per well. Each dot represents one biological replicate (one unrelated healthy human donor). Colored points and error bars display the mean ± SD for three technical replicates of each biological replicate. Black error bars display the mean ± SD of the biological replicates. Significance values are from a linear mixed-effects model.
Cell attachment was comparable among the eight substrates for B cells and monocytes (Fig. 2B). While the mean number of cells retained showed no statistically significant difference among the substrates, the mean number of cells retained was lower in SPA than in other substrates (Fig. 2B). In contrast, neutrophils were retained better in 3D hydrogel with SPA than in any of the other substrates tested (Fig. 2A,B). For CD4+ T cells, PDL and 3D hydrogel-based substrates had the highest average level of attachment, with SPA again being the substrate with the lowest attachment.
We chose PDL as a substrate for subsequent experiments, due to its lower cost and greater availability. Given that our subsequent experiments involved the measurement of induction or repression of inflammatory genes, we then tested whether the PDL substrate alone could trigger a transcriptional response by classic inflammatory genes. We cultured primary human monocytes from each of four biological replicates (unrelated healthy donors) in the presence or absence of PDL. As a positive control, cells in both culture conditions were stimulated with LPS. We then measured, by qPCR, the expression of three genes known to be transcriptionally reactive in monocytes upon cellular activation: TNF, IL6, and IFNB. We found no significant differences in expression between cells cultured in the presence or absence of PDL (Fig. 2C).
Because the number of available primary human cells is often limited in practice, we then tested whether the retention ratios for each of the four cell types, cultured in PDL substrate, would change over a range of cell concentrations. We found no statistically significant differences in retention ratios for any of the four cell types tested, at concentrations of 25,000, 50,000, or 100,000 cells per well (Fig. 2D).
The results of these experiments indicate that different primary immune cell types can be successfully cultured short-term in 384-well imaging plates coated with a variety of substrates, with sufficient cell retention after fixation and automated liquid handling to allow for HCR followed by HCI.
Detection of up- or down-regulation of gene expression in human primary immune cells
We then tested whether hcHCR could be used to quantify up-regulation or down-regulation of gene expression at the single-cell level in primary immune cells (Fig. 3). As an example of gene expression increase, we measured transcript abundance for the gene TSC22D3 (GILZ), a classic glucocorticoid-inducible gene which has been studied extensively in human and animal models (D'Adamio et al. 1997; Cannarile et al. 2001). As expected, human primary B cells treated for 2 h with the glucocorticoid methylprednisolone (MP) showed a fourfold up-regulation of TSC22D3 (GILZ) compared to vehicle-treated cells, measured as the number of TSC22D3 HCR spots per cell (Fig. 3A,B). As an example of gene expression decrease, we measured transcript abundance for the gene TNF, which encodes the inflammatory cytokine tumor necrosis factor α (TNF), in human primary monocytes treated with MP for 2 h after 30 min of lipopolysaccharide (LPS) stimulation. In response to LPS, monocytes are known to produce large quantities of TNF by induction of gene expression (Chen et al. 1985; Kornbluth and Edgington 1986), whereas glucocorticoids like MP are known to suppress this induction (Waage and Bakke 1988; Hodge et al. 1999). Upon sequential LPS stimulation and MP treatment, and as compared to LPS stimulation alone, we were able to detect a fourfold decrease in TNF transcript abundance, measured as the number of TNF HCR spots per cell (Fig. 3C,D).
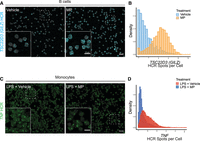
Detection of up- or down-regulated genes. (A) TSC22D3 (GILZ) transcript abundance as HCR spots/cell (blue) after in vitro treatment of human primary B cells with vehicle (0.1% ethanol) or methylprednisolone (MP) (200 µg/dL) for 2 h. Magnification: 60×. Scale bar for full FOV: 20 microns. Scale bar for inset: 10 microns. (B) Density plots showing the distributions of TSC22D3 transcript abundance after MP or vehicle treatment. (C) TNF transcript abundance as HCR spots/cell (green), after in vitro stimulation of human primary monocytes with LPS (1 ng/mL) for 30 min, followed by treatment with vehicle (0.1% ethanol) or MP (200 µg/dL) for 2 h. Magnification: 60×. Scale bar for full FOV: 20 microns. Scale bar for inset: 10 microns. (D) Density plots showing the distributions of TNF transcript abundance after LPS stimulation followed by vehicle or MP treatment.
These results indicate that hcHCR can reliably measure up-regulation or down-regulation of gene expression upon treatment of primary human immune cells with different chemicals.
Simultaneous quantification of transcript abundance for multiple genes at the single-cell level
One of the most appealing properties of HCR is that this technique can simultaneously measure the expression of several RNA transcript species in the same cell (Choi et al. 2018). We sought to test multiplexed, high-throughput HCR by simultaneously incubating primary human monocytes with DNA oligo probe sets against three transcripts: the LPS-nonresponsive housekeeping gene PGK1, and those encoding the inflammatory cytokines TNF and IL1B, which are induced transcriptionally by LPS (Shalek et al. 2013). Samples were then stained with probe set-specific HCR amplification hairpins labeled with different fluorophores. We performed a TNF and IL1B mRNA up-regulation time course by stimulating monocytes with LPS for increasing amounts of time, fixing them, then performing HCR staining as described above. As expected, an increasing number of HCR foci in the fluorescence channels corresponding to TNF and IL1B appeared with longer exposure of monocytes to LPS (Fig. 4A), indicating increased mRNA abundance for both genes in response to the stimulus. Single-cell analysis of TNF and IL1B mRNA expression by hcHCR 30 min after vehicle or LPS stimulation revealed a positive correlation between expression of TNF and IL1B (Fig. 4B). Visual inspection of the images generated in the presence of LPS at 15 min revealed the appearance in some cells of one or two predominant, large and bright nuclear HCR foci for TNF and IL1B, which likely represent sites of active transcription at each of the two alleles of each gene (Fig. 4C). The pattern of TNF and IL1B responses to LPS, as measured by hcHCR, was consistent across biological replicates (primary monocytes obtained from three unrelated healthy donors) and the measured levels of expression of the control gene did not change significantly in response to LPS (Fig. 4D). We then used hcHCR to test a matrix of experimental conditions in which the LPS concentration and the length of LPS exposure were changed (Fig. 4E). Using this approach, we could document an increase of both TNF and IL1B expression in the population of monocytes after 30 min in the presence of LPS at concentrations as low as 0.01 ng/mL, when compared to baseline (Fig. 4E,F). At LPS concentrations of 0.1 ng/mL or higher, the induction of TNF and IL1B expression was already evident at 15 min (Fig. 4E). The results of hcHCR were, again, consistent across biological replicates, and there was no significant change in the measured expression of the control gene across the range of LPS concentrations tested (Fig. 4F). Finally, longer times of exposure to LPS (60 or 120 min; Fig. 4D,E), or LPS concentrations of 10 ng/mL or higher (Fig. 4F), did not result in further measurable increases in TNF or IL1B expression as measured by hcHCR, possibly indicating a saturation of the signal or the induction of negative regulatory mechanisms. The results of these experiments demonstrate that hcHCR can simultaneously detect the expression of multiple mRNA transcripts in single cells. They also indicate that hcHCR can rapidly measure changes in gene expression across a range of experimental conditions using a limited number of human primary immune cells.
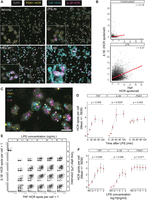
Simultaneous quantification of transcript abundance for multiple genes. Single-cell level measurement of gene expression changes for three genes, TNF (cyan), IL1B (magenta), and PGK1 (yellow) assayed in the same reaction in primary human monocytes stained with DAPI (gray). (A) Time-series showing HCR signals for TNF, IL1B, and PGK1 following vehicle or LPS (1 ng/mL) stimulation at 15-, 30-, and 60-min time points. Magnification: 60×. Scale bar for full FOV: 20 microns. Scale bar for inset: 10 microns. (B) Scatter plots of TNF and IL1B gene expression, quantified as the number of HCR spots per cell. Cells were stimulated with vehicle or LPS for 30 min before hcHCR. Least-squares regression lines are in red. r = Pearson correlation coefficient. (C) Appearance of large and bright nuclear IL1B or TNF HCR spots in the cell nucleus upon LPS stimulation (arrowheads). Magnification: 60×. Scale bar: 10 microns. (D) Line plots of gene expression changes, measured simultaneously by hcHCR, for TNF, IL1B, and PGK1 before and after LPS (1 ng/mL) stimulation at different time points. Results of three independent experiments performed on cells from unrelated healthy human donors. P-values are from a Kruskal–Wallis one-way ANOVA on ranks. (E) Scatter plots of IL1B and TNF expression after LPS stimulation at six concentrations (0, 0.01, 0.1, 1, 10, or 100 ng/mL) and five time points (0, 15, 30, 60, or 120 min). (F) Line plots of gene expression, measured simultaneously by hcHCR, for TNF, IL1B, and PGK1 after 15 min of LPS (1 ng/mL) stimulation at different concentrations. Results of three independent experiments performed on cells from unrelated healthy human donors. P-values are from a Kruskal–Wallis test (one-way ANOVA on ranks).
Assessment of technical and biological variation in hcHCR measurements
We then evaluated the reproducibility of hcHCR in measuring gene expression changes upon a chemical treatment. Human primary monocytes were purified from three unrelated healthy donors. For each biological replicate, each assay was performed in 12 technical replicates (wells). To incorporate measurements of both up- and down-regulation of gene expression in this assessment, we performed in vitro stimulation with LPS for 30 min, followed by treatment with methylprednisolone or vehicle. We again performed multiplexed hcHCR with three genes: TNF, IL1B, and PGK1. TNF and IL1B expression are known to be reduced in primary human monocytes in response to glucocorticoids, whereas PGK1 is not glucocorticoid-responsive (Cao et al. 2021). We observed a 12-fold induction of TNF expression when comparing unstimulated with LPS-stimulated monocytes (Fig. 5A). As expected, in vitro treatment of LPS-stimulated cells with MP reduced TNF expression to less than one-half when compared with the LPS-stimulated samples that were not treated with MP (Fig. 5A). Similarly, we observed a sevenfold induction of IL1B in the presence of LPS, and a reduction of IL1B expression by more than one-half compared to the LPS-stimulated samples, when monocytes were subsequently treated with MP (Fig. 5B). These results were consistent in the three biological replicates (Fig. 5A,B). In contrast, no significant induction by LPS or response to MP was observed for the negative control gene PGK1 (Fig. 5C).
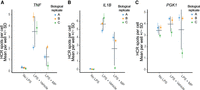
Assessment of technical and biological variation in hcHCR data. Human primary monocytes were obtained from three unrelated healthy donors (biological replicates) and hcHCR was performed with TNF (A), IL1B (B), or PGK1 (C) as the target mRNAs in 12 wells per donor (technical replicates). Measurements were performed at baseline (no LPS), after stimulation with 1 ng/mL LPS for 30 min followed by vehicle treatment (0.1% EtOH) for 2 h (LPS + Vehicle), or after stimulation with 1 ng/mL LPS for 30 min followed by methylprednisolone treatment (200 µg/dL) for 2-h (LPS + MP). Each dot represents one biological replicate. Colored error bars display the mean ± SD of the 12 technical replicates measured in each biological replicate. Gray error bars display the mean ± SD of the biological replicates.
We then assessed the level of technical variation in the assay, as measured by differences in hcHCR measurements obtained in cells from the same individual, that were seeded and chemically treated in separate wells of the same plate. For hcHCR with TNF as the target mRNA, the coefficient of variation (CV) for the 12 technical replicates (averaged across the three biological replicates) had a mean of 31% at baseline, 11.5% after LPS stimulation, and 32.5% in cells stimulated with LPS then treated with MP (Fig. 5A). For hcHCR with IL1B as the target mRNA, the CV had a mean of 5.4% at baseline, 10.8% after LPS stimulation, and 12.7% in cells stimulated with LPS then treated with MP (Fig. 5B). For hcHCR with PGK1, the CV had a mean of 8.1% at baseline, 7.7% after LPS stimulation, and 13.9% in cells stimulated with LPS then treated with MP (Fig. 5C).
Finally, we evaluated the level of variation in expression across HCR measurements generated in cells obtained from different biological replicates (unrelated individuals). We found evidence of substantial biological variation in the expression of the three genes, especially in response to stimulation and treatment (Fig. 5A–C). At baseline, the mean TNF spots/cell was 0.29 with SD = 0.08 and CV = 27%. After LPS stimulation, the mean was 3.58 with SD = 1.37 and CV = 38%. In cells stimulated with LPS then treated with MP, the mean was 1.3 with SD = 0.83 and CV = 64% (Fig. 5A). For IL1B expression, the mean cell intensity at baseline was 91.27 with SD = 10.19 and CV = 11%. After LPS stimulation, the mean was 667.36 with SD = 70.19 and CV = 10.5%. In cells stimulated with LPS then treated with MP, the mean was 267.2 with SD = 153.7 and CV = 57.5% (Fig. 5B). For PGK1, the mean spots/cell at baseline was 3.44 with SD = 0.41 and CV = 11.9%. After LPS stimulation, the mean was 4.02 with SD = 0.67 and CV = 16.7%. In cells stimulated with LPS then treated with MP, the mean was 3.48 with SD = 1.76 and CV = 50.1%.
These results highlight the importance of considering and quantifying both technical and biological sources of variation when working with primary human cells. They also highlight the ability of hcHCR to account for both, by generating data for up to thousands of cells per technical replicate, in multiple technical replicates per donor, even in situations where it is only feasible to obtain and purify a relatively small number of cells from each donor.
hcHCR allows cell gating based on gene expression
The high-content image data generated in an hcHCR experiment can be converted to the flow cytometry standard (FCS) file format that commonly serves as input for flow cytometry data analysis software. This offers the advantage of easily visualizing and performing gating of single-cell events based on the measured gene expression values. To illustrate this, we purified primary T cells (total CD3+ cells) from a healthy donor and performed hcHCR with CD4 and FOXP3 as the target mRNAs. The resulting image data were converted to the FCS format, and the flow cytometry software FlowJo was used to generate histograms of spots per cell (Fig. 6). Gates were created for CD4-positive (defined as cells with ≥1 CD4 spots) and CD4-negative cells (Fig. 6, top), and the proportions of FOXP3-positive or negative events were quantified for the cells in each gate. While transcript-level and protein-level expression cannot be equated (Liu et al. 2016), and therefore the expected proportions of cells in each gate cannot be simply extrapolated from cell-surface flow cytometry data, these results demonstrate the possibility of visualizing and gating cells based on gene expression measurements obtained by hcHCR.
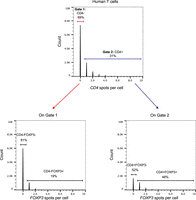
hcHCR allows cell gating based on gene expression. Human primary T cells (total CD3+ T cells) were obtained from a healthy donor and hcHCR was performed with CD4 and FOXP3 as the target mRNAs. The hcHCR image output was converted to FCS format, and histograms of the spots-per-cell counts were displayed in the flow cytometry software FlowJo. Gates were created for CD4-positive (defined as cells with ≥1 CD4 spots/cell) or CD4-negative cells (top), and FOXP3 expression was displayed for the events in each gate (bottom).
DISCUSSION
We have developed an imaging-based method for measuring relative transcript abundance at the single-cell level, with high-throughput, in human primary immune cells. The method combines the high sensitivity of the HCR assay with the speed, scalability, and technical reproducibility of high-content imaging, and we abbreviate it as high-content HCR (hcHCR). While hcHCR is not intended to replace other methods for medium- or high-throughput quantification of gene expression, it has advantages that make it especially suitable for a range of applications.
Compared to scRNA-seq, hcHCR is considerably simpler and higher-throughput, making it more scalable for experiments that involve testing tens or hundreds of experimental conditions, and allowing the use of several technical replicates per condition, if needed. Because cells are imaged directly on the plate and not captured, it also has the potential to reduce biases in cell representation introduced by the capture step. In addition, genes with very low transcript abundance are likely to be excluded in scRNA-seq, yet they are likely to be assayed directly by HCR. Genes with high transcript abundance in very few cells can also be excluded at the capture step, or lead to misclassification of the cell in scRNA-seq pipelines; by simply imaging more fields of view, hcHCR can easily be scaled up to quantify 10,000–20,000 cells per well, thus increasing the sampling size and the accuracy of relative quantification for such genes. On the other hand, scRNA-seq has the advantage of simultaneously assaying up to a few thousand transcripts on any given cell which, although a shallow representation of the transcriptome, is much broader than what can be achieved by hcHCR. Bulk RNA-seq can offer a deeper analysis of the entire transcriptome, at the expense of single-cell resolution. We see these methods as complementary, with RNA-seq offering the possibility of identifying a subset of genes that could be appropriate markers for the response to a specific perturbation, and hcHCR providing a scalable way to assay the expression of these marker genes in a wide range of conditions, doses, and cell types.
Real-time quantitative PCR (qPCR) is another technique for quantification of transcript abundance. The most scalable and most widely used form of qPCR involves bulk measurements of RNA obtained from all the cells in a well. The obvious advantage of hcHCR is the single-cell resolution, which allows the evaluation of subsets of cells within a well that may be more or less transcriptionally active or responsive to perturbation. With the ability to multiplex, hcHCR also offers the advantage of assessing correlation in the magnitude of the response at the level of different genes in individual cells. For example, in our validation studies it was evident that the human monocytes that responded to LPS with the strongest induction of TNF expression were the same cells that responded with the strongest induction of IL1B expression. Methods for single-cell qPCR have been developed (Taniguchi et al. 2009). Like scRNA-seq, these rely on a capture step, which reduces their scalability and introduces the possibility of capture biases compared to imaging of the cells directly on the plate.
Since we envisaged the use of hcHCR for medium- to high-throughput applications, we optimized the image acquisition and analysis conditions to maximize the number of cells acquired and analyzed per experimental conditions, the number of wells per experimental condition, and the number of treatments per experiment. Prioritizing speed and throughput over spatial and axial resolution results in subsampling as compared to the Nyquist criteria, thus not allowing quantitative single-molecule mRNA detection, as measured by smFISH, or single-molecule localization (nuclear vs. cytoplasmic). This means that one limitation of hcHCR is that it cannot measure absolute mRNA levels, like smFISH and digital droplet PCR (ddPCR), but rather relative changes in transcript levels between different experimental conditions, and as such it cannot be used for the estimate of biophysical parameters of gene expression. On the other hand, hcHCR stands squarely in the field of HCI assays for medium- to high-throughput screening, where any imaging-based measurements for each experimental treatment (well) are relative to several positive and negative controls on the same plate.
HCR has been successfully applied to flow cytometry (Choi et al. 2018), and that method offers many of the advantages of hcHCR, including high sensitivity and single-cell resolution. The ease of scalability to hundreds or thousands of samples is an advantage of hcHCR over HCR-flow cytometry. The greater availability of flow cytometers over high-content imaging equipment is likely to be an advantage of HCR-flow cytometry at some institutions.
Considering its relative advantages and limitations, we believe that hcHCR will be most suitable for medium-throughput screens for the biological effects of perturbing agents such as chemical compounds, RNAi, or targeted genome editing. The applicability of the method to primary cells is important, as it allows for screens with multiple biological replicates and opens the possibility of studying cells directly obtained from patients with the particular disease state being studied.
MATERIALS AND METHODS
Cell purification
Human peripheral blood hematopoietic cells were obtained from the Department of Transfusion Medicine at the National Institutes of Health (NIH) Clinical Center, under NIH study 99-CC-0168, Collection and Distribution of Blood Components from Healthy Donors for In Vitro Research Use, which was approved by the Clinical Center's Institutional Review Board. Peripheral blood was collected in Vacutainer EDTA tubes (Becton Dickinson; cat. no. 366643). Mononuclear cell subsets were obtained by isolation of PBMCs by gradient centrifugation in SepMate tubes (STEMCELL Technologies; cat. no. 85460), with Ficoll-Paque PLUS (GE Healthcare Life Sciences; cat. no. 17-1440-03). Immediately after isolation, and before treatment, mononuclear cells were incubated overnight in RPMI 1640 (Thermo Fisher Scientific; cat. no. 11875093) and 10% FBS at 4°C, followed by immunomagnetic enrichment for the specific cell subset with EasySep Human Cell Enrichment Kits (STEMCELL Technologies). B lymphocytes and CD4+ T lymphocytes were isolated from PBMCs by negative selection (STEMCELL Technologies; cat. nos. 19054 and 19052, respectively). Monocytes were isolated from PBMCs by positive selection (STEMCELL Technologies; cat. no. 17858), to ensure inclusion of the CD14+/CD16+ fraction, which would be excluded with the use of a negative-selection kit. Neutrophils were freshly isolated directly from whole blood by negative selection immunomagnetic purification with the EasySep Direct Human Neutrophil Isolation Kit (STEMCELL Technologies; cat. no. 19666).
Cell adherence to multiple substrates
Custom EvaluPlate Attachment Surfaces plates (BioMedTech Laboratories, Inc.) were generated by coating wells of CellCarrier-384 Ultra imaging microplates (PerkinElmer; cat. no. 6057300) with eight different cell culture matrices: MS-1, MS-2, MS-3, 3D-Hydrogel, Poly-D-Lysine (PDL), Synthetic Poly-Amine (SPA), 3D-Hydrogel PDL, or 3D-Hydrogel SPA. 384-well coated imaging plates were stored at −20°C. They were equilibrated to room temperature for an hour after removal from storage. Each of the four cell types (B cells, monocytes, neutrophils, and CD4+ T cells) from each of three unrelated healthy participants were plated at three different concentrations of 100,000, 50,000, or 25,000 cells/well in three technical replicates. Cells were plated in 40 µL RPMI 1640 and 10% FBS. After incubation for 2 to 4 h at 37°C, 5% CO2, the cell fixative was added directly to the medium, to a final concentration of 4% paraformaldehyde (PFA) (Electron Microscopy Sciences; cat. no. 15714) in a BlueWasher automated liquid handler (Blue Cat Bio). The plates were incubated for 15 min at room temperature followed by three washes with 1× PBS and by permeabilization with 70% ethanol at −20°C for 20 to 70 h. Before imaging, cells were washed multiple times with 1× PBS to mimic the HCR protocol washes, and stained with DAPI (2.5 ng/µL) for 20 min at room temperature. After discarding DAPI, 50 µL of 1× PBS was added to each well and the plate was imaged as described below.
Quantitative PCR
Monocytes from four unrelated healthy donors were plated (100,000 cells/well) on CellCarrier-384 Ultra microplates coated with PDL, or uncoated Falcon 384-well microplates (Corning; cat. no. 353962), as described above. After 2 h of rest at 37°C and 5% CO2, cells received either no LPS or LPS (1 ng/mL) stimulation for 30 min. For harvesting, medium was removed, cells were resuspended in 500 μL of TRIzol Reagent (Thermo Fisher Scientific; cat. no. 15596018) and stored at −80°C until the time of RNA purification. Total RNA was isolated by extraction with TRIzol Reagent, followed by column-based purification with the RNA Clean & Concentrator-5 kit (Zymo Research; cat. no. R1016). cDNA was synthesized with the SuperScript IV VILO Master Mix with ezDNase Enzyme kit (Thermo Fisher Scientific; cat. no. 11766050). Quantitative PCR (qPCR) reactions were carried out using TaqMan assays (Applied Biosystems) with gene-specific primers and FAM (6-carboxyfluorescein)-conjugated probes (IDT). The sequences of the primers and probes used were:
HPRT forward (F): CTGGAAAGAATGTCTTGATTGTGG, reverse (R): CTT GCGACCTTGACCATCTT, probe: 56-FAM/AGACTTTGCTT/ZEN/TCCTTGGTCAGGCA.
TNF (F): CCAGGGACCT CTCTCTAATCA, (R): TCAGCTTGAGGGTTTGCTAC, probe: 56-FAM/AGTGACAAG/ZEN/CCTGTAG CCCA.
IL6 (F): AAGCTCTATCTCCCCTCCAGGA, (R): GCAACTGGACCGAAGGC, probe: 56-FAM/CTTCTCCAC/ZEN/AAGGGCCT.
IFNB1 (F): TGAGCAGTCTGCACCTGAA, (R): ACAGTGACTGTACTCCTTGG, probe: 56-FAM/ATTCTGCAT/ZEN/TA CCTGAAG.
qPCR was performed in a QuantStudio 6 Flex Real Time PCR System (Applied Biosystems). Relative expression values (2−ΔCt, where Ct1 is the value for the gene of interest and Ct2 is the value for HPRT) were calculated for each gene. Statistical testing was performed with a Wilcoxon signed-rank (paired) test, with an algorithm implemented in the R package exactRankTests, which handles ties in computing an exact P-value.
Human monocyte activation for TNF and IL1B mRNA expression measurements
Monocytes from three unrelated healthy participants were plated in 30 µL of RPMI 1640 and 10% FBS on CellCarrier-384 Ultra microplates coated with PDL (PerkinElmer; cat. no. 6057500) at a concentration of 100,000 cells/well. After 2 h of rest at 37°C and 5% CO2, cells were stimulated in technical replicates with six different LPS concentrations (0, 0.01, 0.1, 1, 10, and 100 ng/mL) at five time points (0, 15, 30, 60, and 120 min). Negative (LPS 0 ng/mL) and positive (LPS 100 ng/mL) 120-min stimulations with hairpin-only controls were also performed (two hairpins + TNF probe, two hairpins + IL1B probe, two hairpins without primary probe). All the wells were fixed, washed and permeabilized overnight as described in the “Cell adherence to multiple substrates” section. HCR was performed, as described in the “RNA HCR” section.
Human T cell activation for CD4 and FOXP3 mRNA expression measurements
T cells were freshly isolated directly from human whole blood by negative selection immunomagnetic purification with the EasySep Direct Human T Cell Isolation Kit (STEMCELL Technologies; cat. no. 19661). Cells were resuspended in RPMI 1640 and 10% FBS and activated using ImmunoCult Human CD3/CD28 T Cell Activator (STEMCELL Technologies; cat. no. 10971). Cells with or without activation were plated in 60 µL of RPMI 1640 and 10% FBS on CellCarrier 384-well Ultra Microplates coated with PDL (PerkinElmer; cat. no. 6057500) at a concentration of 250,000 cells/well. After 24 h of incubation at 37°C and 5% CO2, plates were centrifuged at 170 g for 5 min. The cells were then fixed, washed and permeabilized overnight as described in the “Cell adherence to multiple substrates” section. This was followed by RNA-HCR. For T cells, wells were multiplexed with CD4 and FOXP3 probes at a concentration of 10 nM and 2 nM, respectively. Hairpin-only controls were also included (two hairpins, H1 and H2, labeled with Alexa Fluor 568 or Alexa Fluor 647, without primary probes).
RNA HCR
For prehybridization, the 70% ethanol permeabilization buffer was discarded by inverting the plate and pat-drying, followed by aspiration of the remaining buffer with a sterile 200 µL tip attached to a sterile 2 mL aspirating pipette. Plates were air-dried for 10 min at room temperature to remove any residual ethanol. Wells were rehydrated by three 5-min washes in 80 µL of 5× saline-sodium citrate, 0.1% Tween 20 (5× SSC-T) buffer (Ambion; cat. no. AM9763) at room temperature. HCR probe sets, amplifiers, probe hybridization buffer, and amplifier buffer (Molecular Instruments, v3.0) were used for HCR. For equilibration, 16 µL of probe hybridization buffer was added to each well and incubated for 10 min at 37°C. Primary probe-hybridization mix was prepared by multiplexing pairs (odd and even) of each probe set to a final concentration of 2 nM in probe hybridization buffer. After aspirating the equilibration buffer from each well, 11 µL of prewarmed (37°C) probe-hybridization mix was added to each well. The plates were immediately sealed with an aluminum seal (Fisher Scientific; cat. no. 07-000-379) and incubated in a humidified 37°C incubator for 12–18 h. After overnight incubation, the probe-hybridization mix was aspirated, followed by four 15-min washes in a 37°C water bath with prewarmed solutions (37°C) to remove the excess probes. The first wash was performed with 75% of probe wash buffer/ 25% 5× SSC-T; this was followed by a wash with 50% of probe wash buffer/50% 5X SSC-T, then by a wash with 25% of probe wash buffer/75% 5× SSC-T, then by a wash with 100% 5× SSC-T. After the fourth wash, one more wash was performed with 5× SSC-T for 5 min at RT. To equilibrate the plates before HCR amplification, the wash buffer from each well was aspirated, and 16 µL of amplification buffer were added and incubated at room temperature for 30 min. Amplification hairpins were prepared by thawing on ice followed by snap-heating at 95°C for 90 sec and equilibrating to room temperature for 30 min. Each hairpin was multiplexed to a final concentration of 60 nM in amplification buffer (2X SSC, 0.1% Triton-X 100, 10% dextran sulfate). Before adding the multiplexed hairpins to the wells, the amplification buffer was aspirated and 11 µL of multiplexed hairpin mix was added. Plates were incubated at room temperature for 45 min, followed by two 30-min and one 5-min washes with 5× SSC-T at room temperature. Cells were stained with DAPI (2.5 ng/µL) for 20 min at room temperature and either imaged immediately or stored at 4°C in 50 µL of 1× PBS.
High-throughput image acquisition
Plates stained with HCR probe sets and amplification hairpins were imaged on a CV7000S high-throughput spinning disk confocal microscope. Samples were first excited using a 405 nm solid state laser, a 405/488/561/640 nm excitation dichroic mirror, a 60× water objective (NA 1.2), a 568 nm emission dichroic mirror, and a 445/45 nm bandpass emission filter to detect the DAPI signal. The second exposure used simultaneous excitation with 488 and 640 nm lasers, the same excitation dichroic mirror, objective, and emission dichroic mirror as the first exposure, and 525/50 nm and 676/29 nm bandpass emission filters to detect the Alexa Fluor 488 and Alexa Fluor 647 signals, respectively. For both exposures, we used 2 sCMOS cameras (2560 × 2160 pixels) with bin setting of 2 × 2 (pixel size: 0.216 microns) to acquire 3D z-stacks of five images at 1 µm intervals, which were maximally projected, background and shading corrected, and registered on the fly during image acquisition by Yokogawa proprietary algorithms, then saved as .tif files. For each well, we acquired four fields of view (FOV).
High-content image analysis
Images were imported and analyzed in Columbus v 2.7, 2.8, or 2.9 (PerkinElmer). Briefly, nuclei were segmented using the DAPI channel, and dilated by a fixed percentage to generate an approximate cell body region of interest. HCR foci were first detected over the cell body region using Columbus spot finding algorithm C, and then filtered using a user-trained Fisher Linear Discriminant classifier based on fluorescence intensity and contrast. The output of dHCR was number of HCR spots per cell. Since the pixel size used during acquisition (0.216 microns) was higher than the Nyquist criteria for optimal spatial sampling (two to three times more frequent sampling than the theoretical spatial resolution afforded by diffraction limited imaging, or ∼0.250 microns, for an optimal sampling rate of ∼0.100 microns in these conditions), and since all the images analyzed were maximally projected on the fly, HCR spot counts measured in hcHCR cannot be considered actual single mRNA molecule counts. As a result, hcHCR spot counts are a proportional measurement of relative mRNA abundance in the cell, and hcHCR can quantify relative but not absolute changes in mRNA abundance between treatments. The choice to subsample was made to increase speed and throughput of the assay for potential high-throughput applications, and it does not impact hcHCR's ability to measure differences between a test treatment and a control, which is what all HCI assays are designed for. Single-cell results were exported from Columbus as text files.
Data display
Single-cell results generated in Columbus were used to generate plots using R (4.1, R Core Team) and RStudio Desktop (RStudio). Original .tif files were processed in FIJI/ImageJ (NIH) by changing only brightness and contrast settings over the entire FOV and by maintaining them constant among different experimental conditions in the same figure panel. Grayscale 16-bit images from different channels were merged, and then converted to 8-bit RGB format.
For visualization of image data with standard flow cytometry software, single-cell results were exported from Columbus in comma-separated-value (CSV) format. The files were then converted to flow cytometry standard (FCS) format with the CsvToFcs module of GenePattern (Spidlen et al. 2013). Data in FCS format were displayed and gated in FlowJo, v10. Plots and images were assembled into figures with Adobe Illustrator (Adobe).
Statistical analysis
To assess the difference in cell attachment across substrates, a linear mixed-effects model was fitted to account for the repeated measurements on cells obtained from the same participants and cultured on wells coated with different substrates. To assess the difference of retention ratios across cell concentrations, a linear mixed-effects model was fitted to account for the repeated measurements on cells obtained from the same participants and cultured at different cell concentrations. In both cases, the resulting P-values reflect the significance of the within-participant differences under different conditions.
The choice of a statistical method for the analysis of hcHCR data should be determined by the distribution of the assay readouts. In this study, we assayed samples from multiple biological replicates, and the readout was the average of HCR spot count per cell over multiple cells (>1000 cells per well, in the experiments presented). HCR spot counts per cell approximately follow a log-normal distribution (Fig. 3B,D). The distribution of the average spots per cell over multiple cells in each biological replicate is expected to be close to normal, based on the central limit theorem, but this distribution is not ascertainable with the relatively small number of biological replicates included in this study. Therefore, the nonparametric Kruskal–Wallis test was applied to the comparison of hcHCR results across conditions (Fig. 4D,F).
LPS stimulation and methylprednisolone treatment
Monocytes from three unrelated healthy participants were plated as described above, in the “Human monocyte activation for TNF and IL1B mRNA expression measurements” section. After 2 h of rest at 37°C and 5% CO2, cells either received no LPS or were stimulated with LPS (1 ng/mL) for 30 min followed by vehicle (0.1% EtOH) or methylprednisolone (200 µg/dL) (Millipore Sigma, cat. no. M0639) treatment for 2 h. Cells were fixed, washed and permeabilized overnight as described above in the “Cell adherence to multiple substrates” section. This was followed by hcHCR.
ACKNOWLEDGMENTS
This study was funded by the Intramural Research Programs of the National Institute of Allergy and Infectious Diseases; the National Cancer Institute, and the National Institute of Arthritis and Musculoskeletal and Skin Diseases, all at the National Institutes of Health.
Footnotes
-
Article is online at http://www.rnajournal.org/cgi/doi/10.1261/rna.079239.122.
- Received May 27, 2022.
- Accepted June 6, 2022.
This is a work of the US government.
REFERENCES
MEET THE FIRST AUTHORS


Meet the First Author(s) is a new editorial feature within RNA, in which the first author(s) of research-based papers in each issue have the opportunity to introduce themselves and their work to readers of RNA and the RNA research community. Manasi Gadkari and Jing Sun are the co-first authors of this paper, “High-throughput imaging of mRNA at the single-cell level in human primary immune cells.” Manasi is a senior research associate in the Functional Immunogenomics Section at the National Institute of Arthritis and Musculoskeletal and Skin diseases, National Institutes of Health. Her research focuses on understanding and studying glucocorticoid-mediated immunoregulation. Jing is a biologist in the Signaling Systems Section at the Laboratory of Immune System Biology, National Institute of Allergy and Infectious Diseases, NIH. Her research focuses on TLR signaling, with a particular focus on IRAK function and the role of ubiquitin modification.
What are the major results described in your paper and how do they impact this branch of the field?
In this paper, we developed a high-content imaging method (hcHCR) quantifying mRNA at the single cell in human primary immune cells. We first tested eight attachment substrates for imaging human immune cells and found PDL to be the best attachment substrate. We then validated the hcHCR method by detecting increased or decreased mRNA transcript abundance under various experimental conditions at the single-cell level in a 384-well format, and demonstrated the feasibility of simultaneously measuring the expression of multiple genes per cell, both at baseline and in response to an experimental stimulus. Our results show that hcHCR is a robust assay, suitable for low- to medium-throughput screens in primary human cells, and it opens the possibility of performing personalized screens on cells from patients with a specific disease.
What led you to study RNA or this aspect of RNA science?
MG: My research focuses on the application of advanced genomics to the study of the effects of glucocorticoids on human immune and nonimmune cells. The transcriptional responses to glucocorticoids differ across cell types, even for genes that are similarly expressed at baseline. The need to capture cell-to-cell variability and transcriptional regulation at the level of individual cells led us to study mRNA at the single-cell level combined with high-throughput screening for dissecting biological effects of perturbing agents.
JS: My research interest has been in the field of TLR signaling. The immune cell response to TLR ligand stimulation at the mRNA level is an important aspect of this. Due to heterogeneity in the response of individual cells, it is important to investigate inflammatory gene expression at the single-cell level. High-content imaging (HCI) has shown its power in high-throughput screens at the single-cell level, with speed, scalability and technical reproducibility. Combining HCI with the high sensitivity of the hybridization chain reaction (HCR) for the visualization of RNA in single cells, the hcHCR technique we developed will be a powerful tool to advance our knowledge in TLR signaling at the mRNA level.
What are some of the landmark moments that provoked your interest in science or your development as a scientist?
MG: I learned from my parents that there could be no better way to connect to your community than by serving humanity. My interest in science was cemented while pursuing my undergraduate degree in pharmacy. I realized that I am only a small link in a vast chain and that my contribution can only be conceived in relation to all the work that has been done ahead of mine. It is this conviction that my work could make a difference that prompted me to pursue a master's degree and to dedicate myself to research in molecular biology and genetics.
JS: When I graduated from Peking University Health Science Centre, Dr. Tao Qimin was the head of the Hepatology Institute at our school. Dr. Tao's team developed the first generation of HBV vaccines in China in the 1970s and she risked herself to receive the first vaccine to test its safety. Under her leadership, the Hepatology institute was ranked as the top institute in China. Inspired by her, I joined the clinical part of the institute and became a physician-scientist.
If you were able to give one piece of advice to your younger self, what would that be?
MG: Be prepared to be a multidisciplinary scientist, regardless of what your focus was when you were in school. Different projects and even different experiments within singular projects will be more aptly viewed through a diverse set of scientific lenses, and a geneticist might see a data set differently than a protein chemist. If you can synthesize alternative manners of thinking, you are likely to get much more out of your results. Along with that, the best data are verified via multiple experimental methodologies, and if you don't understand the underlying science behind the “how” and “why” of those methods, then they won't be nearly as informative.
JS: Think boldly—that is the piece of advice I would give my younger self. As a Chinese female scientist, I was deeply influenced by traditional Chinese culture, believing in hard work and being humble. I generated high-quality data but tended to believe in prevailing theories and not be confident enough to generate my own hypotheses. Plato is dear to me, but dearer still is truth. Science is subject to change. That is why it is so much fun pursuing science.
What were the strongest aspects of your collaboration as co-first authors?
JS: It is always a pleasure collaborating with Manasi. Manasi works in the Franco lab and has a background in molecular and human genetics, as well as expertise working with human primary cells. I work in the Fraser lab and have knowledge of innate immunology and experience with techniques for detecting immune cell response to TLR ligands. With the supervision of Drs. Franco, Pegoraro, and Fraser, we designed and executed the experiments together and this collaboration was a great success.
How did you decide to work together as co-first authors?
MG: Jing Sun has expertise and deep understanding of the mechanisms of cell signaling, which was perfect for working together as coauthors on this project given my interests in genomics and her interests in cell signaling. Jing's teamwork and skills are second to none, and having worked with her in the past I knew this would be a fruitful collaboration.




