


Experimental evidence for the correlation between RNA structural fluctuations and the frequency of beneficial mutations
- Yutaro Maeda1,
- Ryo Mizuuchi2,3,
- Shuji Shigenobu4,
- Atsushi Shibai5,
- Hazuki Kotani5,
- Chikara Furusawa5,6 and
- Norikazu Ichihashi1,2,6
- 1Department of Life Science, Graduate School of Arts and Science, The University of Tokyo, Meguro-ku, Tokyo, 153-8902, Japan
- 2Komaba Institute for Science, The University of Tokyo, Meguro-ku, Tokyo 153-8902, Japan
- 3JST, PRESTO, Kawaguchi, Saitama 332-0012, Japan
- 4National Institute for Basic Biology, Myodaiji, Okazaki, Aichi 444-8585, Japan
- 5Center for Biosystems Dynamics Research, RIKEN, Suita, Osaka 565-0871, Japan
- 6Universal Biology Institute, Graduate School of Science, The University of Tokyo, Bunkyo-ku, Tokyo 113-0033, Japan
- Corresponding author: ichihashi{at}bio.c.tokyo-u.ac.jp
Abstract
RNA has been used as a model molecule to understand the adaptive evolution process owing to the simple relationship between the structure (i.e., phenotype) and sequence (i.e., genotype). RNA usually forms multiple substructures with similar thermodynamic stabilities, called structural fluctuations. Ancel and Fontana theoretically proposed that structural fluctuation is directly related to the ease of change in structures by mutations and thus works as a source of adaptive evolution; however, experimental verification is limited. Here, we analyzed 76 RNA genotypes that appeared in our previous in vitro evolution to examine whether (i) RNA fluctuation decreases as adaptive evolution proceeds and (ii) RNAs that have larger fluctuations tend to have higher frequencies of beneficial mutations. We first computationally estimated the structural fluctuations of all RNAs and observed that they tended to decrease as their fitness increased. We next measured the frequency of beneficial mutations for 10 RNA genotypes and observed that the total number of beneficial mutations was correlated with the size of the structural fluctuations. These results consistently support the idea that the structural fluctuation of RNA, at least those evaluated in our study, works as a source of adaptive evolution.
Keywords
INTRODUCTION
RNA has been utilized as a model molecule to understand adaptive evolutionary processes because of its simplicity (Schuster et al. 1994; Fontana and Schuster 1998a,b; Schultes and Bartel 2000; Fontana 2002). The adaptive evolutionary process of an RNA toward a target structure can be simulated based on thermodynamic stability because the phenotype (i.e., structure) of an RNA is relatively easily predicted by its genotype (i.e., sequence) (Zuker and Stiegler 1981; McCaskill 1990).
Usually, RNA forms multiple substructures with similar thermodynamic stabilities and transiently switches between such an ensemble of structures by thermal noise. This repertoire of structures is referred to as structural fluctuations. Ancel and Fontana theoretically showed that structural fluctuation (plasticity in their term) is directly related to the ease of changing structures by mutations (genetic variability) (Ancel and Fontana 2000). They termed this relationship plastogenetic congruence. According to this relationship, structural fluctuation works as a source for adaptive evolution and thus decreases during adaptive evolution as fitness increases (Ancel and Fontana 2000). These findings show that highly fluctuating RNA has a larger evolutionary potential (i.e., a higher frequency of adaptive mutations) than nonfluctuating RNA. The accuracy of this hypothesis would help us predict the evolutionary potential of RNA from structural fluctuations without performing an evolutionary experiment. However, the previous theoretical analysis was not verified by experiment.
Previously, we developed a translation-coupled RNA replication system from artificial genomic RNA (∼2000 nt) encoding an RNA replication enzyme (Qβ replicase) and a reconstituted translation system. We previously demonstrated the in vitro adaptive evolution of RNA through long-term replication in micro-sized water-in-oil droplets (Ichihashi et al. 2013). During evolution, 91 genotypes, comprising 22 types of mutations, successively appeared and competitively increased their frequencies in the population (Ichihashi et al. 2015). In a previous study, we measured the activity of the encoded replicase before (round 0) and after the accumulation of the 22 mutations (round 32) by using each purified replicase and found no significant difference in their activities. In contrast, the ability of RNAs to be replicated as templates was significantly improved by the mutations (Ichihashi et al. 2013; Mizuuchi et al. 2020). The ability of RNAs to be replicated was reported to be predominantly influenced by RNA structures (Mills et al. 1978; Axelrod et al. 1991; Biebricher and Luce 1993; Usui et al. 2015). We believe that the RNAs that increase their fitness by gradually improving their structures can be ideal samples to investigate the transition of structural fluctuations during adaptive evolution.
In this study, we examined two hypotheses based on the previous theoretical study by Ancel and Fontana (Ancel and Fontana 2000): (i) RNA fluctuation decreases as adaptive evolution proceeds, and (ii) RNAs that have larger fluctuations have larger frequencies of beneficial mutations. First, we computationally estimated the structural fluctuations of 76 RNAs that appeared in the early part of the previous in vitro evolution. We observed that structural fluctuations tended to decrease as the fitness increased. Next, we measured the frequency of beneficial mutations in the point mutation libraries for 10 RNAs and found that the frequencies were correlated with the size of the structural fluctuations. We further revealed that the structural fluctuation decreased at a higher rate with the introduction of newly identified beneficial mutations than with random mutations. These results were consistent with the two hypotheses, supporting the notion that structural fluctuations work as a source for adaptive evolution.
RESULTS
RNAs used in this study
In our previous study, we performed an in vitro evolutionary experiment using a translation-coupled RNA replication system, which comprises an RNA (2125 nt) encoding the catalytic subunit of Qβ replicase, originating from an RNA bacteriophage, and a reconstituted translation system of Escherichia coli encapsulated in microscale water-in-oil droplets (Ichihashi et al. 2013). In this system, the replicase was translated from the RNA and then replicated the RNA (Fig. 1A). Mutations were spontaneously introduced by replication errors. We repeated the processes of translation-coupled RNA replication, RNA extraction, and reencapsulation with a new reconstituted translation system for 32 rounds. Mutant RNAs with higher replication abilities (i.e., higher fitnesses) successively appeared and dominated the population. We sequenced the RNA populations at 11 points in the course of evolution and observed the appearance of 91 different genotypes (Ichihashi et al. 2015).
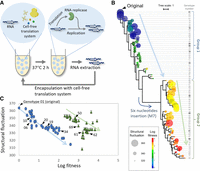
Relationship between sequences, fitness, and the structural (phenotypic) fluctuations of the 76 RNAs used in this study. (A) Scheme of the previous evolutionary experiment of RNA. An RNA that encodes an RNA replicase replicated in a translation-coupled manner in a reconstituted E. coli translation system. When repeating the RNA replication in microscale water-in-oil droplets through the incubation cycle at 37°C for 2 h, RNA extraction, and reencapsulation with the new translation system, the RNA continuously replicated and evolved by introducing mutations through replication error. We analyzed 76 RNA genotypes that appeared during the previous evolution. The fitness (replication ability) of the RNAs increased depending on the structural changes, which affect the ability of the RNA to be replicated. (B) Phylogenetic tree of the 76 genotypes. The color and size of each circle represent the fitness values and the structural fluctuations, respectively. (C) Relationship between the fitness and the structural fluctuations of the 76 genotypes. Genotypes to be analyzed later are indicated. The blue and green arrows represent plausible orders of appearance. The error bars represent the standard error of the Hamming distances (structural fluctuation) (n = 1000).
In this study, we focused on 76 genotypes, which appeared in the earlier rounds of evolution and successively accumulated 17 types of mutations, including 14 point mutations, two 3-nt deletions, and one 6-nt insertion (Supplemental Fig. S1). We omitted the other 15 RNAs that appeared in the later rounds because they acquired multiple mutations simultaneously, and the phylogenic relationships were unclear. The fitness (replication ability) of each selected RNA was estimated from each frequency dynamics (Ichihashi et al. 2015). Fitness primarily depended on the ability to be replicated as a template during previous evolution (Ichihashi et al. 2013; Mizuuchi et al. 2020) and this ability strongly depends on the secondary structure (Mills et al. 1978; Axelrod et al. 1991; Biebricher and Luce 1993; Usui et al. 2015). Accordingly, we regarded the secondary structures as “the phenotype” of these RNAs.
Analysis of structural fluctuation
We investigated the relationship between structural (phenotypic) fluctuations and the potential for adaptive evolution. For this purpose, we first computationally predicted the structural fluctuations of 76 RNAs using a secondary-structure prediction algorithm. Generally, RNA sequences have multiple structures with similar thermodynamic stabilities. To analyze such structural variation (fluctuation), we first calculated the partition function of each base using RNAstructure (Reuter and Mathews 2010). We randomly sampled 1000 structures based on their partition functions (Ding and Lawrence 2003) and then calculated the average Hamming distance, the number of differences between all combinations of the sampled 1000 structures as a measure of structural fluctuation.
We first compared the sequences, fitness values, and structural fluctuations of the 76 RNAs on a phylogenetic tree (Fig. 1B). The size and color of each circle represent the structural fluctuation and the natural logarithms of each fitness value, respectively. The original genotype (genotype 01) was placed at the top of the tree. The tree can be divided into two groups: group 1, which contains the original genotype, and group 2, which is derived from group 1 by acquiring the 6-nt insertion at position 155. We observed that the fitness tended to increase (i.e., the color became closer to red) with an increased accumulation of mutations (i.e., toward the bottom of the phylogenetic tree). We also found that structural fluctuation roughly tended to decrease within groups 1 and 2 (i.e., the sizes of the circles decreased) toward the bottom of the phylogenetic tree.
To evaluate these trends quantitatively, we plotted the structural fluctuations and natural logarithms of fitness (Fig. 1C). RNAs can be roughly separated into two clusters corresponding to those in group 1 (blue circles) and group 2 (green triangles). A plausible evolutionary process is as follows: In group 1, the original RNA accumulates mutations to increase fitness and decrease structural fluctuations. This process occurs by successive accumulation of point mutations and small deletions. Then, an RNA in the cluster probably acquired the 6-nt insertion at position 155, increasing structural fluctuation. The RNA further accumulated point mutations and small deletions in group 2 to increase fitness and slightly decrease structural fluctuations. This result showed that the structural fluctuation tends to decrease as fitness increases during adaptive evolution, which is consistent with a previous theoretical study (Ancel and Fontana 2000). However, an unexpected increase by insertion occurred. The possible effects and causes of the insertion are discussed in the Discussion section.
Measurement of the frequencies of adaptive mutations and correlation with structural fluctuations
Next, we examined the relationship between structural fluctuations and adaptive evolutionary potential. Adaptive evolutionary potential can be evaluated by the frequency of beneficial mutations in a random mutation library because more beneficial mutations in a random mutation library implies a larger chance to adaptively evolve. Figure 2A depicts the schematic representation of this method. First, we chose 10 RNAs (genotypes 01, 06, 19, 20, 34, 50, 61, 62, and 69) with varied structural fluctuations from the 76 genotypes and introduced random mutations to create a random mutation library. Second, the RNA library was replicated over several generations. During the reaction, each mutant RNA replicated depending on its fitness, and each mutation frequency in the final population reflected the relative fitness gain of the mutation. Third, the mutation frequencies were measured by deep sequencing to estimate the relative fitness gain of each mutation after removing the background noise caused by sequencing error (the detailed procedure is described in the Materials and Methods section). The relative fitness gain distribution is represented as a histogram, and the total number of beneficial mutations was used in the subsequent analysis.
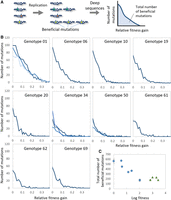
Measurement of the frequency of beneficial mutations. (A) Method to measure the frequency of adaptive mutations. A random mutation library of each RNA was replicated for several generations, and the frequencies of point mutations were measured by next-generation sequencing. The relative fitness gain of each mutation was estimated from the frequencies. The total number of beneficial mutations was used for the later analysis. (B) Distributions of beneficial mutations for each genotype. (C) Relationship between the total number of beneficial mutations and log fitness of each RNA. The error bars represent the standard error of the total number of beneficial mutations for genotypes 01, 34, and 50 (n = 3).
We initially applied this method to the original RNA (genotype 01) and obtained their distributions (top left panel in Fig. 2B). To examine the distribution reliability, we first compared the reproducibility of the mutation frequency. We performed three independent measurements and compared their frequencies (Supplemental Fig. S2A). The frequencies in different experiments exhibited strong correlations (correlation efficiencies, r = 0.98 and 0.84), confirming reproducibility. Second, we assessed whether the known beneficial mutations were included in the distribution. In a previous study, we identified three beneficial point mutations (A186G, C167U, and U203C) introduced into genotype 01 during evolution (Ichihashi et al. 2013). All the mutations were included in the distribution at high relative fitness gain, except for C167U, which was excluded from the analyzed sequence region. Finally, we compared the positions of the identified mutations. In the previous study, we reported that the introduced beneficial mutations shown in Supplemental Figure S1B were located in the RNA terminal regions. We then plotted the top 100 most frequent mutations in the distribution and observed that the mutated positions were similar to the already known beneficial mutations (Supplemental Fig. S2B). These results support the reliability of the distribution obtained using this method.
We then applied this method to nine other RNAs (genotypes 06, 10, 19, 20, 34, 50, 61, 62, and 69). For genotypes 34 and 50, we independently performed the same measurements thrice. All distributions were similar to exponential distributions; the number of mutations significantly decreased as the relative fitness gains increased, consistent with previously measured fitness gain distributions of other protein systems (Eyre-Walker and Keightley 2007). The shapes of the distributions are broadest for the original genotype 01 and narrower for the later genotypes. From this distribution, we calculated the total number of beneficial mutations and plotted them against their log fitness value (Fig. 2C). The total number of beneficial mutations showed a decreasing trend as the log fitness increased (i.e., evolution proceeded), whereas the numbers seemed to be maintained for the RNAs in group 2 (green triangles). To examine the relationship between mutations and structural fluctuations, we plotted the total number of beneficial mutations against structural fluctuations (Fig. 3). The plot exhibited a correlation (r = 0.7) between the two values, supporting the hypothesis that RNAs with larger fluctuations have higher frequencies of beneficial mutations.
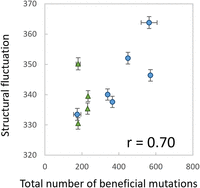
Relationship between the total number of beneficial mutations and the structural fluctuations. The error bars of the y-axis represent the standard errors of the Hamming distance (structural fluctuation) (n = 1000). The error bars of the x-axes represent the standard error of the total number of beneficial mutations for genotypes 01, 34, and 50 (n = 3).
We performed another investigation to further examine the relationship between the beneficial mutations and structural fluctuations. The first hypothesis, that is, the RNA fluctuation decreases as adaptive evolution proceeds, would be confirmed if the structural fluctuations decreased with the introduction of beneficial mutations. To evaluate this possibility, we introduced each of the top 100 most beneficial mutations or 100 random mutations into the original RNA (genotype 01) and compared their structural fluctuations. The violin plot is shown in Figure 4. When a random mutation was introduced, only 36 out of 100 mutations decreased the structural fluctuation, and the average structural fluctuation was 366.4, which was slightly larger than the original value (363.8). When a beneficial mutation was introduced, more than half (63 out of 100) of the mutations decreased the structural fluctuations. The average structural fluctuation was 358.9, which was smaller than the original value (363.8). These results support the first hypothesis: that the introduction of beneficial mutations tended to decrease the structural fluctuation more than random mutations.
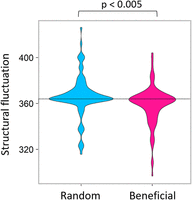
Effect of the beneficial mutations on the structural fluctuation. For random mutations, each of 100 randomly chosen mutations was introduced into genotype 01. For the beneficial mutations, each of the top 100 most effective beneficial mutations found in Figure 2 for genotype 01 was introduced into genotype 01. The structural fluctuation of each point mutant was estimated as described in the Materials and Methods section. The structural fluctuation level of genotype 01 is indicated with a dotted line. The differences in the distributions between the random and beneficial mutations were significant based on the Student's t-test (P < 0.005).
Structural fluctuations during other in vitro evolution
To examine the generality of the decreasing trend in structural fluctuation during evolution, we searched for other RNAs that underwent successive mutational accumulation during in vitro evolution. One example of this is the Tetrahymena ribozymes. Lehman and Joyce obtained numerous variants with different activities (i.e., fitness) during the in vitro directed evolution (Lehman and Joyce 1993). We estimated the RNA structural fluctuations and plotted them against ribozyme activity (Supplemental Fig. S3). The fluctuation exhibited a slightly decreasing trend as the activity increased. This result supports the generality of the decreasing trend in the structural fluctuations of the evolving RNAs.
Calculation of ensemble diversities
The structural fluctuation we used here is similar to ensemble diversity, calculated from the base-pairing probability according
to 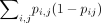 using the ViennaRNA package (Lorenz et al. 2011). We found that, similar to the structural fluctuation, the ensemble diversities tended to decrease as fitness increased
(blue circles, Supplemental Fig. S4A), and correlated with the total number of beneficial mutations for the RNAs in group 1 (blue circles, Supplemental Fig. S4B, r =0.61). However, unlike structural fluctuations, a decreasing trend was not observed for the RNAs in group 2 (green triangles)
(Fig. 1C; Supplemental Fig. S4A), and the total correlation coefficient (0.17) was smaller than that for structural fluctuation (Fig. 3; Supplemental Fig. S4B). A possible explanation for these differences is provided in the Discussion section.
using the ViennaRNA package (Lorenz et al. 2011). We found that, similar to the structural fluctuation, the ensemble diversities tended to decrease as fitness increased
(blue circles, Supplemental Fig. S4A), and correlated with the total number of beneficial mutations for the RNAs in group 1 (blue circles, Supplemental Fig. S4B, r =0.61). However, unlike structural fluctuations, a decreasing trend was not observed for the RNAs in group 2 (green triangles)
(Fig. 1C; Supplemental Fig. S4A), and the total correlation coefficient (0.17) was smaller than that for structural fluctuation (Fig. 3; Supplemental Fig. S4B). A possible explanation for these differences is provided in the Discussion section.
DISCUSSION
We examined the following two hypotheses derived from a previous theoretical study (Ancel and Fontana 2000) using the 76 RNAs that appeared in the course of the previous in vitro evolution: (i) RNA fluctuation decreases as adaptive evolution proceeds, and (ii) RNAs that have larger fluctuations have higher frequencies of beneficial mutations. The decrease of structural fluctuations with increased fitness (Fig. 1C) and by the introductions of beneficial mutations (Fig. 4) support the first hypothesis. The correlation between structural fluctuations and the frequency of beneficial mutations (Fig. 3) supported the second hypothesis. Collectively, these results provide experimental evidence for the role of structural fluctuations as a source of adaptive evolution. This knowledge is useful in evaluating the evolutionary potential of RNA without performing evolutionary experiments.
Notably, the structural fluctuation slightly increased by introducing a 6-nt insertion during the evolution (green triangles in Fig. 1C) not only around the inserted region, but also other distant regions (Supplemental Fig. S5). Although we cannot explain how the insertion increased fitness, this increase in structural fluctuation suggests that the insertion destabilizes the structures in the RNA and may produce a route for further evolution toward a new structure. In a previous theoretical study, discontinuous shape transitions were achieved by a series of mutations through drift in a neural network (Fontana and Schuster 1998a,b). Our findings suggest that innovative changes can also occur by inserting new sequences. This might explain why the elongation of RNA with random sequences was occasionally effective in directed evolution (Jaeger et al. 1999; Johnston et al. 2001; Ikawa et al. 2004).
One limitation of this study is the resolution of structural fluctuations. In this study, we evaluated a single value to measure the structural fluctuation of the whole RNA sequence. In principle, the structural fluctuation of the region that is important for RNA replication (i.e., not the whole region) should correlate with evolutionary potential. The RNA used here was expected to contain both more and less essential regions for replication. We analyzed the structural fluctuations of the whole RNA region since we lacked sufficient information regarding the importance of each region. Clearer correlation would be observed if we identify the important regions for replication and analyzed the structural fluctuations of the regions.
The decreasing trend in the structural fluctuation as fitness increases (Fig. 1C; Supplemental Fig. S4A) and the correlation with the total number of beneficial mutations (Fig. 3; Supplemental Fig. S4B) were less clear for the RNAs in group 2 than those in group 1. This can be explained if the fitness of RNA is determined not only by its structure, but also by other factors, such as nucleotide sequences and encoded protein activity. As noted in the Introduction, we showed that fitness is predominantly determined by the structures during the evolutionary experiment analyzed here, but we cannot deny that other factors have a minor effect on fitness, and the effect possibly stands out in the later stage of evolution after the structures are sufficiently optimized. Therefore, in the early stage of evolution (e.g., in group 1), fitness is mainly determined by structures, and thus the relationship between the structural fluctuation and fitness or the total number of beneficial mutations is clear, while in the later stage of evolution (e.g., in group 2), the fitness can be affected by other factors and thus the trends of the structural fluctuations may become less clear.
As a measure of the structural diversity of an RNA sequence, we mainly used “structural fluctuation,” calculated from 1,000 structures sampled based on the partition function. As another simpler measure, we also used ensemble diversity, calculated directly from the base-pairing probabilities of each base (Supplemental Fig. S4). Both measures showed a similar decreasing trend as fitness increased for the RNAs in group 1 (blue circles, Fig. 1C; Supplemental Fig. S4A) and a similar correlation with the total number of beneficial mutations, especially for the RNAs in group 1 (blue circles, Fig. 3, and Supplemental Fig. S4B), supporting the validity of these trends irrespective of the measures of structural diversity in the early stages of evolution. However, the decreasing trend of the ensemble diversity as fitness increased was not observed for the RNAs in group 2 (green triangles, Supplemental Fig. S4A). The correlation coefficient for ensemble diversity (0.17; Supplemental Fig. S4B) was smaller than that of structural fluctuation (0.70, Fig. 3), although the correlation coefficient for group 1 was similar (0.61, blue circles in Supplemental Fig. S4B). One possible reason for these differences is that the two measures handle the interactions among base pairs differently. Ensemble diversity is calculated by summing the base pair probabilities, p, multiplied by 1-p for all bases; thus, the co-occurrence of or exclusion (i.e., interaction) among base pairs was not taken into account. In contrast, structural fluctuation was calculated from the distance between 1000 distinct structures sampled according to the stability of each overall structure; thus, the effect of the co-occurrence of or exclusion among base pairs is included in this measure. Although further investigation is needed to find reliable measures, the main conclusions of this study (the decreasing trend of the structural fluctuation [or ensemble diversity] as fitness increases and the correlation between the structural fluctuation [or ensemble diversity]) and the total number of beneficial mutations) are valid for both measures, at least for the early stage of evolution (i.e., in group 1).
A similar relationship between structural (phenotypic) fluctuations or robustness and evolutionary potential has been reported for other biological systems, such as proteins and gene regulatory networks (Wagner 2005). For proteins and RNAs, the promiscuous enzymatic activity is considered a source of the evolution of new enzymatic activity (Aharoni et al. 2005; Pandya et al. 2014; Janzen et al. 2020), and promiscuity could be caused by plastic structures (i.e., structural fluctuation) (Wroe et al. 2007; Tokuriki and Tawfik 2009). A recent analysis of hundreds of protein structures supports the correlation between noise-induced protein dynamics and mutation-induced variation (Tang and Kaneko 2021). For gene regulatory networks, robustness (i.e., smaller fluctuations) develops through evolution (Ciliberti et al. 2007). Theoretically, a similar relationship between fluctuating phenotypic traits and higher evolutionary potential has been reported in a simplified cellular model and bacterial transcriptome data (Kaneko 2011; Furusawa and Kaneko 2015). The concept that structural (phenotypic) fluctuation works as a source for adaptive evolution may apply to a broad range of biological systems. Experiments using RNA as a model molecule could contribute to comprehensively understanding this phenomenon owing to its simplicity.
MATERIALS AND METHODS
RNA preparation
The 76 RNA sequences analyzed in this study are listed in the Supplemental Information (the “Sequences” sheet). To prepare purified RNAs of the 10 genotypes (genotypes 01, 06, 10, 19, 20, 34, 50, 61, 62, and 69), plasmids encoding each RNA under the T7 promoter with the SmaI site at the 3′ terminus were prepared from pUCmdv(−)β(+) (Kita et al. 2008) by introducing the corresponding mutations shown in Supplemental Figure S1. The plasmids were digested with SmaI and transcribed using T7 RNA polymerase (Takara) as per the manufacturer's instructions. After degrading the plasmids with DNase I (Takara), the RNA was purified using an RNeasy column (QIAGEN).
Phylogenetic tree construction
The genotypes used in this study contained 17 point mutations, two deletions, and one insertion (Supplemental Fig. S1B). To calculate the distance matrix, we first estimated the mutation rates of these mutations. To estimate the deletion rates (M4 and M5) and the insertion (M7) rates, we analyzed deep sequence data for the RNA population before the reaction. We obtained a rate of 0.044 for the deletions (2425 reads containing the deletion in 55,348 reads) and 0.000084 for the insertion (nine reads containing the insertion in 106,842 reads). Sequence data were obtained from a previous study (Ichihashi et al. 2015). We used the same mutation rate (0.044) for both deletions because the deleted nucleotides (CAC) were the same for the two deletions and occurred in the same repeating region of CAC nucleotides of the histidine-tag sequence. For all point mutations (M1–3, 6, 8–17), we used the previously estimated value of 0.0004 (Ichihashi et al. 2013). We calculated the distance matrix using these mutation rates and then drew a phylogenetic tree based on the distance matrix using the neighbor-joining method (Saitou and Nei 1987). Colored circles were manually attached.
Estimation of the structural fluctuation
Partition function calculation and sampling of 1000 secondary structures were performed using RNAstructure software ver. 5.8 with default parameters (Mathews et al. 2009; Giegerich and Voß 2014). The average Hamming distance between all combinations of the 1000 structures was used as the structural fluctuation. The Hamming distance between two structures was calculated as follows. We compared base-pairing partners at each position of two structures. We increased the Hamming distance by one if (i) the nucleotide at a position is base-paired in one of the structures but not in the other structure, or (ii) the nucleotides at a position in the two structures are base paired with nucleotides at different positions.
Measurement of the distribution of beneficial mutations
Each purified RNA (1 nM) was replicated under the same conditions as the previous in vitro evolution (Ichihashi et al. 2013), except that the reaction mixture contained purified Qβ replicase (100 nM) (Ichihashi et al. 2010) to enhance replication. Purified RNA was expected to contain random mutations introduced during the in vitro transcription process at approximately 0.0002 per nucleotide (Ichihashi et al. 2013). The solution was encapsulated into water-in-oil emulsions as described previously (Ichihashi et al. 2013) and incubated at 37°C for 1–2 h. RNA concentrations were measured before and after incubation by quantitative PCR after transcription (One Step TB Green PrimeScript PLUS RT-PCR Kit, Takara) with primers 1 and 2 to measure fold replication (i.e., the number of RNA replication cycles). The logarithms of the fold replications were later used as Rori(t)/Rori(0). After incubation, the RNA was purified and reverse-transcribed with primer 3. The cDNA was PCR-amplified with primers 3 and 4, as described previously (Ichihashi et al. 2013).
DNA fragments were subjected to deep sequencing using the Illumina MiSeq. After trimming 30 bases at both termini, the reads were aligned with BWA (Li and Durbin 2009) and processed using Samtools (Li et al. 2009). Reads that contained fewer than two mismatches were used. The position of the RNA sequence that covered over 5000 reads, corresponding to nucleotide number 220–2014, was used for subsequent analysis. The number of coverages is listed in the Supplemental Information (the “Coverages” sheet). The number of mutations at each position was counted, and the frequency of each mutation was calculated. To eliminate background mutation rates, the average frequencies of five independent measurements for genotype 01 RNA before replication were subtracted from the data of each genotype after replication. Frequency histograms were obtained using the subtracted frequency. All raw and intermediate data during these processes are presented in the Supplemental Information (see the “Data analysis” sheet).
The following process was applied to convert the x-axis of the histogram (frequency of each mutation) to the relative fitness
gain: The mutated RNA library used for the replication reaction comprised the original nonmutated RNA as a major fraction
and many mutated RNAs as minor fractions. Assuming that an RNA exponentially replicates during the replication reaction, the
original RNA concentration increases during the replication reaction according to the equation  , where Rori(0), fori, and t are the initial concentration of the original RNA, fitness of the original RNA, and incubation time, respectively. Rori(0) was assumed to be the same as the total initial RNA concentration because the original RNA constituted most of the RNA
population. Taking logarithms yields ln(Rori(t)/Rori(0)) = forit. From the replication experiment, we obtained the fold replication (i.e., Rori(t)/Rori(0)) and thus forit values. The frequency of a mutant RNA i, which has fitness fi, increases according to the equation
, where Rori(0), fori, and t are the initial concentration of the original RNA, fitness of the original RNA, and incubation time, respectively. Rori(0) was assumed to be the same as the total initial RNA concentration because the original RNA constituted most of the RNA
population. Taking logarithms yields ln(Rori(t)/Rori(0)) = forit. From the replication experiment, we obtained the fold replication (i.e., Rori(t)/Rori(0)) and thus forit values. The frequency of a mutant RNA i, which has fitness fi, increases according to the equation  , where Pi(0), fi, and t are the initial RNA frequency in the population, the fitness of the RNA i, and the incubation time, respectively. Taking logarithms of the equation gives ln(Pi(t)) = ln(Pi(0)) + (fi − fori)t. Dividing the equation with forit gives ln(Pi(t)) − ln(Pi(0))/forit = fi − fori/fori. The left-hand side of the equation could then be measured. Pi(t) was obtained from the frequency of each mutation in the RNA population after replications obtained using the deep sequence
described above. Pi(0) is the expected initial frequency of each mutation, estimated to be 0.0002 in a previous study (Ichihashi et al. 2013). forit was obtained above from the fold replication values. The resultant fi − fori/fori values were used as relative fitness gains. All data before and after the conversion are presented in the Supplemental Information (see the “Data analysis” sheet).
, where Pi(0), fi, and t are the initial RNA frequency in the population, the fitness of the RNA i, and the incubation time, respectively. Taking logarithms of the equation gives ln(Pi(t)) = ln(Pi(0)) + (fi − fori)t. Dividing the equation with forit gives ln(Pi(t)) − ln(Pi(0))/forit = fi − fori/fori. The left-hand side of the equation could then be measured. Pi(t) was obtained from the frequency of each mutation in the RNA population after replications obtained using the deep sequence
described above. Pi(0) is the expected initial frequency of each mutation, estimated to be 0.0002 in a previous study (Ichihashi et al. 2013). forit was obtained above from the fold replication values. The resultant fi − fori/fori values were used as relative fitness gains. All data before and after the conversion are presented in the Supplemental Information (see the “Data analysis” sheet).
DATA DEPOSITION
Data are contained in the article or Supplemental Material. The original data for the figures are shown in the Supplemental Information (the “Original data” sheet).
SUPPLEMENTAL MATERIAL
Supplemental material is available for this article.
ACKNOWLEDGMENTS
The authors thank Mika Ikeda and Dr. Wen Hsin-i for technical assistance. This work was supported by KAKENHI grant number 20H04859 and JST CREST grant number JPMJCR20S1.
Author contributions: Y.M. planned and performed the experiments, analyzed the data, and wrote the manuscript. R.M. analyzed the data. S.S., A.S., H.K., and C.F. obtained and analyzed the sequence data. N.I. planned the experiments, analyzed the data, and wrote the manuscript.
Footnotes
-
Article is online at http://www.rnajournal.org/cgi/doi/10.1261/rna.079291.122.
- Received June 5, 2022.
- Accepted September 28, 2022.
This article is distributed exclusively by the RNA Society for the first 12 months after the full-issue publication date (see http://rnajournal.cshlp.org/site/misc/terms.xhtml). After 12 months, it is available under a Creative Commons License (Attribution-NonCommercial 4.0 International), as described at http://creativecommons.org/licenses/by-nc/4.0/.




