


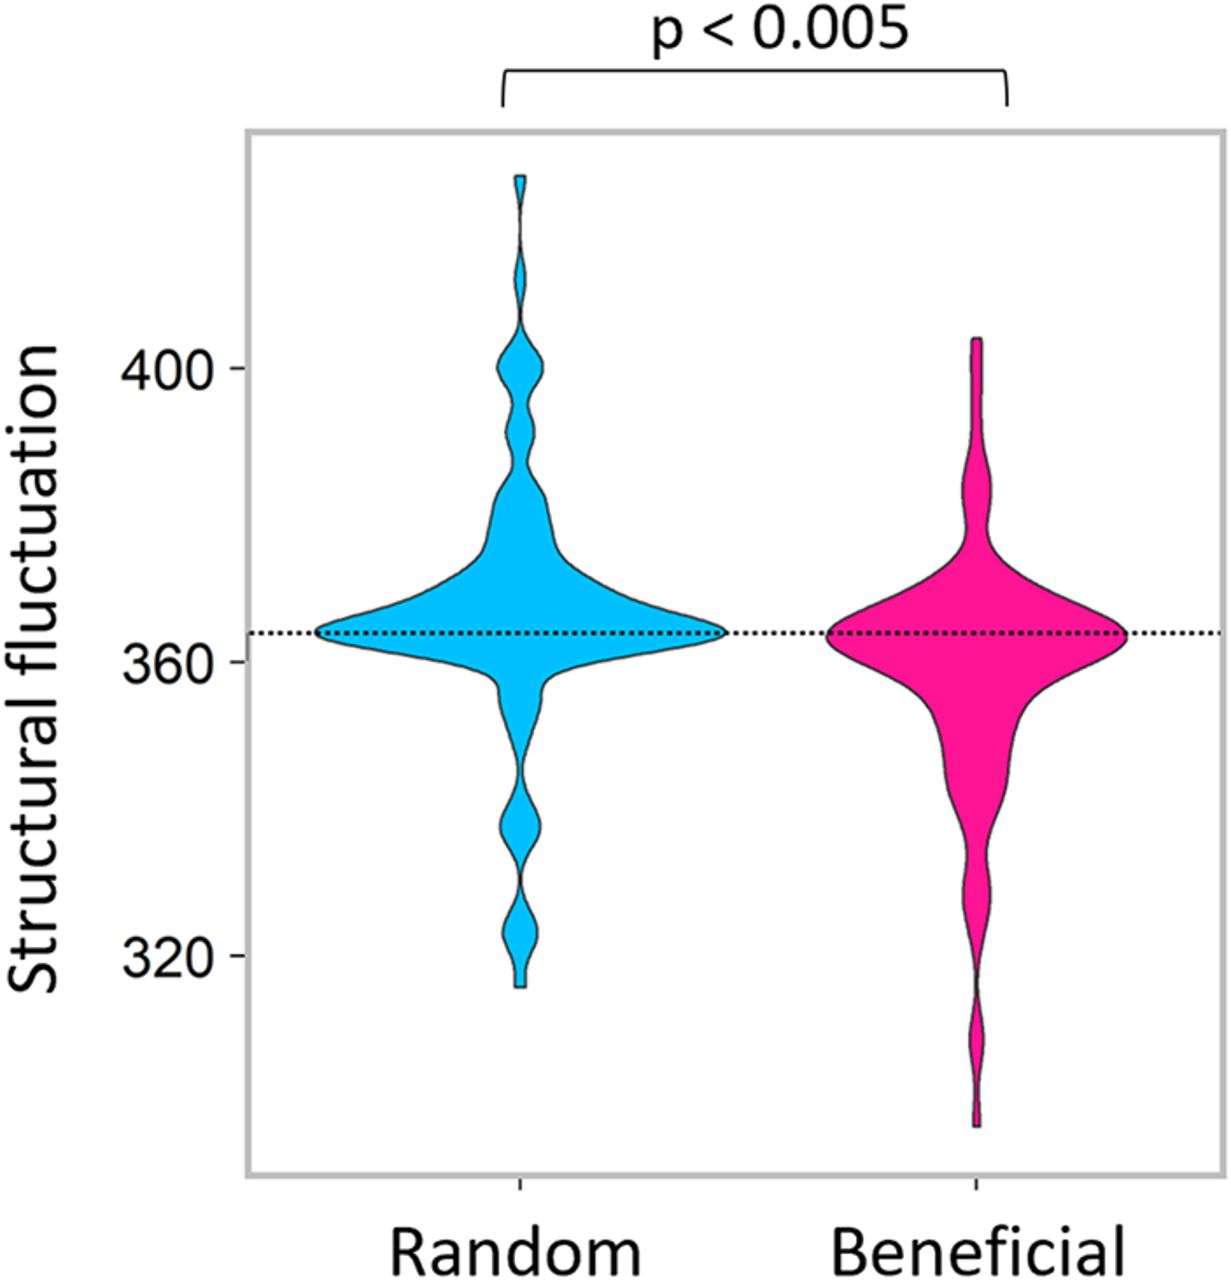
FIGURE 4.
Effect of the beneficial mutations on the structural fluctuation. For random mutations, each of 100 randomly chosen mutations was introduced into genotype 01. For the beneficial mutations, each of the top 100 most effective beneficial mutations found in Figure 2 for genotype 01 was introduced into genotype 01. The structural fluctuation of each point mutant was estimated as described in the Materials and Methods section. The structural fluctuation level of genotype 01 is indicated with a dotted line. The differences in the distributions between the random and beneficial mutations were significant based on the Student's t-test (P < 0.005).




