


Antisense-targeted immuno-EM localization of the pre-mRNA path in the spliceosomal C complex
- Department of Cellular Biochemistry, Max Planck Institute for Biophysical Chemistry, 37077 Göttingen, Germany
Abstract
A first step in understanding the architecture of the spliceosome is elucidating the positions of individual spliceosomal components and functional centers. Catalysis of the first step of pre-mRNA splicing leads to the formation of the spliceosomal C complex, which contains the pre-mRNA intermediates—the cleaved 5′ exon and the intron-3′ exon lariat. To topographically locate the catalytic center of the human C complex, we first determined, by DNA oligonucleotide-directed RNAse H digestions, accessible pre-mRNA regions closest to nucleotides of the cleaved 5′ splice site (i.e., the 3′ end of exon 1 and the 5′ end of the intron) and the intron lariat branch point, which are expected to be at/near the catalytic center in complex C. For electron microscopy (EM) localization studies, C complexes were allowed to form, and biotinylated 2′-OMe RNA oligonucleotides were annealed to these accessible regions. To allow localization by EM of the bound oligonucleotide, first antibiotin antibodies and then protein A-coated colloidal gold were additionally bound. EM analyses allowed us to map the position of exon and intron nucleotides near the cleaved 5′ splice site, as well as close to the anchoring site just upstream of the branch adenosine. The identified positions in the C complex EM map give first hints as to the path of the pre-mRNA splicing intermediates in an active spliceosomal C complex and further define a possible location for its catalytic center.
Keywords
INTRODUCTION
Splicing of pre-mRNA proceeds in the cell nucleus in two transesterification steps. First, the 5′ exon (exon 1) is cleaved at the 5′ splice site from the intron, which circularizes to a “lariat” by ligation of its 5′ end to the 2′-OH of a conserved adenosine within the sequence that defines the branch site. Second, the 3′ splice site is cleaved and the 3′ exon (exon 2) is ligated to the 5′ exon, yielding translatable mRNA. Pre-mRNA splicing is catalyzed by the spliceosome, a large ribonucleoprotein (RNP) complex consisting of the U1, U2, U4/U6, and U5 small nuclear (sn) RNPs plus more than a hundred non-snRNP proteins (Wahl et al. 2009). The spliceosome assembles anew on each intron to be removed. Assembly starts by base-pairing of the U1 and U2 snRNAs with the pre-mRNA's 5′ splice site and branch site, respectively, generating a prespliceosome or “complex A.” In this complex, a 20-nt-long region just upstream of the branch site (the “anchoring site”) interacts sequence-independently with proteins of the U2 snRNP (Gozani et al. 1996). The A complex then recruits the preformed U4/U6.U5 tri-snRNP, in which the U4 and U6 snRNAs are base-paired, to form the mature complex B spliceosome. Complex B, however, still has no catalytic center for the splicing reaction. During the subsequent catalytic activation, complex B undergoes a marked structural change. Base-pairing of U1 snRNA with the 5′ splice site, and that of U4 snRNA with U6 snRNA, are disrupted, allowing U6 bases to pair with both the branch-site-bound U2 snRNA and the 5′ end of the intron, forming a network of RNA–RNA base pair interactions that is thought to be at the heart of the spliceosome's catalytic center (Nilsen 1994; Staley and Guthrie 1998). The activated spliceosome then catalyzes the first transesterification step, leading to “complex C.” Recent comparative mass-spectrometric analyses of the human spliceosomal B and C complexes revealed that the spliceosome also undergoes a dramatic change in protein composition during catalytic activation (Bessonov et al. 2008; Agafonov et al. 2011). About 35 proteins are destabilized or lost during the transition from the B to the C complex, and at the same time, a similar number of other proteins are newly recruited to the spliceosome. The C complex then catalyzes the second transesterification step, and the mRNA is released, leaving behind the post-spliceosomal complex, which contains the excised intron lariat and the U2, U5, and U6 snRNPs. Finally, this complex dissociates into its component snRNPs, which are recycled for new rounds of splicing. The spliceosome is, thus, a highly dynamic molecular machine whose composition is not static and whose structure undergoes several rearrangements during each cycle of splicing.
Although the biochemical composition of the spliceosome's various assembly and functional states is relatively well known, the ultrastructural study of isolated spliceosomes is at a relatively early stage. So far, electron microscopy (EM) has been the method of choice for ultrastructural analyses (Stark and Lührmann 2006). However, EM of such a large, protein-rich, and dynamic complex is challenging because such assemblies can easily disintegrate during purification and sample preparation. We recently developed the GraFix technique, which allows fixation of particles under mild conditions during density-gradient centrifugation and leads to a substantial improvement in their compositional and structural conservation. For example, human B complexes prepared for EM under GraFix conditions are significantly larger and clearly more homogeneous in structure than unfixed B complexes (Boehringer et al. 2004; Deckert et al. 2006; Kastner et al. 2008). The same holds true for complex C; without fixation only a core structure of this complex is observed by EM (Jurica et al. 2002, 2004), whereas under GraFix conditions, complex C has a larger size and also shows considerably more structural detail (Golas et al. 2010). The 3D reconstruction of native C complexes treated in this way reveals an asymmetric particle with a central main body surrounded by characteristically shaped peripheral domains (Golas et al. 2010).
A first step in understanding the spliceosome's architecture is localizing the positions of individual spliceosomal components and functional centers. One route to topographical information is the comparison of the complexes' structures with those of corresponding complexes that have been depleted of given proteins or RNA. This approach was pursued successfully with the GraFix-stabilized human C complex (Golas et al. 2010). That is, it proved possible to fit the structures of a high-salt-washed C complex and of the post-spliceosomal 35S U5 snRNP into the structure of the intact C-complex. Interestingly, the post-spliceosomal U5 snRNP bears a clear structural resemblance to complex C. This observation was surprising, as spliceosomes at the A, B, activated B (Bact), and C stages all differ greatly from one another in their morphology (Deckert et al. 2006; Behzadnia et al. 2007; Bessonov et al. 2010; Golas et al. 2010). Therefore, comparing their EM images does not lead to any reliable topographic conclusions about the positions of common or complex-specific components. Thus, each of these complexes requires a separate strategy to acquire information necessary for understanding its architecture.
Another powerful strategy for topographical localization is the specific labeling and subsequent location by EM of relevant sites. In the human B complex, the U2 protein SF3b155 and various sites of the pre-mRNA (the 5′ and 3′ ends and the intron loop) have been located via EM (Wolf et al. 2009). These pre-mRNA sites were detected by insertion of MS2 hairpin sequences at the respective site and subsequent binding of an MS2-MBP (maltose binding protein) fusion protein. Spliceosomes assembled on this pre-mRNA were treated first with IgG antibodies against MBP and then with colloidal gold bound to protein A (Wolf et al. 2009), which acted as an EM marker. The aforementioned pre-mRNA sites were found at different positions of the structurally heterogeneous head domain of the B complex. The 5′ end of the pre-mRNA, as well as the intron and the pre-mRNA's 5′ and 3′ ends, have also been localized in the C complex (Golas et al. 2010) or its structural core (Alcid and Jurica 2008; Stroupe et al. 2009), respectively. Here, too, the pre-mRNA was labeled by introducing hairpin sequences that bind specifically to marker proteins.
Strategies that are based on the introduction of RNA tags are only possible in regions of the pre-mRNA that do not interfere with the intricate assembly path of the spliceosome. In particular, there are functionally important sites (such as the 5′ splice site and the branch point) to which several different factors bind during assembly, precluding their localization by this method. Therefore, to discover the path followed by the pre-mRNA across the spliceosome close to the active site, we have adopted a different approach that involves “post-assembly” labeling of specific RNA sequences. Oligonucleotides are bound specifically to a defined sequence tract of the pre-mRNA after spliceosomes are formed. Such an oligonucleotide targeting approach was already successfully applied to 30S ribosomal subunits (Oakes et al. 1986; Olson et al. 1988; Oakes and Lake 1990) and the 20S U5 snRNP (Sander et al. 2006).
To this end, we first identified pre-mRNA sequences accessible in the C complex by oligonucleotide-directed RNase H cleavage, scanning exon 1 and the intron sequence up to the branch point. As we wanted to identify and locate accessible pre-mRNA sequences that are closest to the catalytic center, we used a large overlapping set (∼100) of relatively short (12-nt) oligonucleotides to scan the RNA. We next bound long biotinylated antisense 2′-OMe oligoribonucleotides to accessible pre-mRNA nucleotides that should be close to the catalytic center, including one position in exon 1 and two in the intron, i.e., one close to the branch-point-bound 5′ splice site and one close to the anchoring site that precedes the branch site. Protein A-gold-labeled antibiotin antibodies were then used to locate by EM the catalytic center region of the C complex. Our data provide a first idea of the path taken by pre-mRNA within a functional C complex and provide further information on the location of the spliceosome's catalytic center.
RESULTS
Human C complexes were assembled in vitro in HeLa nuclear extract on the PM5 pre-mRNA (Anderson and Moore 1997). The PM5 pre-mRNA has a long polypyrimidine tract but neither a 3′ splice site nor a 3′ exon and allows spliceosome assembly only until the C complex stage (Fig. 1A). These complexes, purified via the MBP-MS2 affinity tag at the pre-mRNA's 5′ end, contained only the splicing intermediates, i.e., the 126-nt-long exon 1, and the 229-nt-long intron lariat. The preparation contained only small amounts of uncleaved pre-mRNA, confirming efficient stalling at the C complex stage (Supplemental Fig. S1B, lanes 1,2). Our purified C complexes can perform the second step (5′ and 3′ exon ligation), when an externally supplied 3′ exon (possessing an intact 3′ splice site) is incubated with the purified complex (data not shown; Bessonov et al. 2008), confirming the presence of a functional catalytic center. In electron micrographs, the purified, GraFix-stabilized C complex shows a characteristic dominant view (Fig. 1B), in which all of the main structural domains already known from the previously reported 3D structure of the C complex can be recognized by their typical positions and appearance (Fig. 1C,D; Golas et al. 2010).
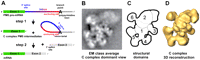
Structure of the human spliceosomal C complex. (A) Schematic of the PM5 pre-mRNA on which C complexes are assembled and the two steps of pre-mRNA splicing. Due to the absence of a 3′ splice site and 3′ exon, step 2 requires the addition of an exogenously added 3′ exon-containing oligonucleotide. The color code for exon 1 (green) and the two intron regions, 5′ splice site (blue) and anchoring site (red), is also used in Figures 3–7. (B) Class average of EM images showing the negatively stained C complex in the dominant view. (C) The six structural domains of the C complex according to Golas et al. (2010) are indicated on a schematic outline of the C complex (dominant view). (D) 3D reconstruction of the human C complex from cryo-EM images (Golas et al. 2010). The 3D structure is shown in an orientation corresponding to the dominant view.
Determination of accessible pre-mRNA sequences
To define pre-mRNA sequences suitable for site-specific labeling, assembled C complexes were further incubated in nuclear extract with a DNA oligonucleotide complementary to the pre-mRNA. If sufficient hybridization to the pre-mRNA occurs, then the RNase H present in the nuclear extract will cleave the pre-mRNA, and the cleavage products can be identified by gel electrophoresis (Fig. 2): A change in the electrophoretic mobility of exon 1 or the intron-lariat indicates accessibility of the targeted pre-mRNA sequence within the C complex. As we wanted to identify accessible sequences as close as possible to the catalytic center, we used a large set of over 100 overlapping dodecadeoxyribonucleotides covering the PM5 pre-mRNA sequence from the 5′ end to the branch point (Supplemental Fig. S1). To determine the accessibility borders with high precision, we constructed our set of oligonucleotides to cover the pre-mRNA sequence in 2-nt steps.
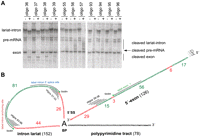
Accessibility of the pre-mRNA in the spliceosomal C complex, as revealed by DNA oligonucleotide-directed RNase H digestion. (A) Cleavage of the pre-mRNA in the C complex by RNase H using oligodeoxynucleotides complementary to the pre-mRNA sequences close to the cleaved 5′ splice site and the branch point. C complexes were assembled on 32P-labeled PM5 pre-mRNA in HeLa nuclear extract, DNA oligonucleotides complementary to selected pre-mRNA regions were added to the splicing reaction, and RNA bound by DNA was then cleaved by the RNase H present in the extract. The cleavage products were separated by gel electrophoresis and visualized by autoradiography. The hybridization positions of the oligonucleotides used here are shown for illustration in B. The cleavage products of the lariat are not sharply resolved but run as diffuse bands in a region above the pre-mRNA. (B) Summary of accessible regions of the splicing intermediates in the C complex as determined by RNase H cleavage. Accessible regions are shown in green and those protected from enzymatic cleavage are shown in red. The stretches that hybridize with the oligodeoxyribonucleotides used in A and with the longer oligoribonucleotides used for EM localization are indicated by black lines. The biotin positions of the three 2′-O-methyl-RNA oligonucleotides used for EM localization (“label intron anchoring site,” “label intron 5′ splice site,” and “label exon 1”) are each indicated with a green asterisk. The individual results of all the RNase H cleavage experiments performed with ∼100 oligonucleotides are shown in Supplemental Figure S1.
The RNase H screen showed that most of exon 1 and the analyzed intron sequences are accessible in assembled C complexes. In exon 1, a long accessible stretch was found to begin ∼48 nt upstream of the cleaved 5′ splice site and to end with a short (6-nt) inaccessible sequence 23 nt before the 5′ MS2 hairpins (Fig. 2; Supplemental Fig. S1). Closer to the 5′ splice site, an additional accessible stretch ∼15 nt in length extended to the ∼29th nt upstream of the 3′ end of exon 1. Within the intron lariat, a large accessible region, starting ∼26 nt downstream from the 5′ end of the intron (connected to the 2′-OH of the branch point) and ending ∼44 nt before the branch-point adenosine, was found (Fig. 2; Supplemental Fig. S1). There was no indication of any additional accessible regions.
We did not analyze the polypyrimidine tract downstream from the branch site, as its inaccessibility to DNA-directed RNAase H cleavage has already been established, at least in C complexes assembled on a pre-mRNA (AdML-GG) that contained exon 2 and a mutated 3′ splice site (Ilagan et al. 2009), and its sequence redundancy would, in any case, hamper a site-specific localization. As only 17, mostly nonoverlapping, 15- to 18-nt-long oligos were used to cover the whole pre-mRNA in the aforementioned study, exact accessibility borders could not be determined. Nonetheless, protected regions were found in exon 1 and the intron that are compatible with our results. In addition, Ilagan et al. (2009) found that the 3′ splice site and exon 2 were largely accessible to RNAse H cleavage. Using a finer RNase H cleavage grid (12-nt-long oligos with a 6-nt overlap), Reichert et al. (2002) determined protected sequences of exon 1 in C complexes assembled on two different pre-mRNAs. They found, similar to our results, that the first 25–27 nt of exon 1 upstream of the 5′ splice site are completely protected, and with one of the pre-mRNAs used, that an additional ∼15-nt-long region further upstream is also protected. Thus, all three RNA chains radiating from the branch point appear well protected over at least a length of ∼25 nt within the C complex. Taken together, these results suggest that a general feature of the C complex is that its catalytic center (containing the branched adenosine, cleaved 5′ splice site, and also the polypyrimidine tract) is largely buried within the complex. The mostly unprotected nature of the 3′ splice site and exon 2 found by Ilagan et al. (2009) suggests that this 3′ region of the pre-mRNA might be quite flexible within the C complex and probably does not add any major structural element.
Strategy for labeling pre-mRNA sequences
In our earlier studies (Wolf et al. 2009; Golas et al. 2010), we labeled the pre-mRNA positions of interest by inserting MS2 aptamers and then binding an MS2-MBP fusion protein. Antibodies against MBP and subsequent labeling with protein A-coated 5-nm colloidal gold (PAG) allowed us to locate the pre-mRNA by EM. The gold labeling procedure has the great advantage that (1) the gold is unambiguously recognizable in an image of negatively stained particles because of its spherical shape and high density, and (2) PAG shows very low unspecific binding to the GraFix-treated particles (Wolf et al. 2009; Golas et al. 2010). A disadvantage of the MS2-MBP procedure is the additional distance between the antibody binding site and the targeted pre-mRNA site resulting from the MS2 hairpins and the adapter protein (MS2-MBP). Furthermore, the MS2 hairpins might also interfere with the spliceosome assembly pathway when inserted close to functional sites of the pre-mRNA. As we wanted in the present work to label pre-mRNA sites as close as possible to the catalytic center, we adopted a “post-assembly” strategy to allow the undisturbed assembly of intact and functionally active C complexes. Only after the C complexes had formed was a label introduced by adding a biotinylated oligonucleotide complementary to an accessible pre-mRNA site close to the catalytic center. Biotin-specific IgG antibodies and finally PAG were then used to localize the label via EM. To assure sufficiently stable binding, we used 30-nt-long 2′-OMe oligoribonucleotides. In each case, the biotin modification was placed at the end of the oligonucleotide that, after hybridization, is positioned most closely to nucleotides of the cleaved 5′ splice site (i.e., the 3′ end of exon 1 and the 5′ end of the intron) and the branch point, which are expected to be at/near the catalytic center immediately after step 1 of splicing.
Location of an exon one sequence proximal to the catalytic center
To label exon 1, we used a 2′-OMe RNA oligonucleotide designated “label exon 1” (Fig. 2B) that binds within the long accessible exon 1 stretch of the pre-mRNA (Fig. 2B). The oligo carries a biotin at its 5′ end which places the biotin 48 nt upstream of the 3′ end of exon 1 after annealing. The oligonucleotide was added after the assembly of C complexes on the 32P-labeled PM5 pre-mRNA in HeLa nuclear extract. After fractionation by glycerol gradient centrifugation, the antibiotin IgG antibody was added to the gradient fractions containing complex C. Thereafter, the labeled C complex was affinity-purified via MS2-MBP affinity selection on amylose beads (Bessonov et al. 2008) and loaded onto a second glycerol gradient that contained a glutaraldehyde gradient (0%–0.1%) to produce a structurally stabilized C complex suitable for EM analysis. ELISA analysis of the fractions showed cosedimentation of the antibody with the C complex, indicating stable IgG-oligo-C complex formation (Supplemental Fig. S2). PAG was then added to the fractions containing C complexes and negative-stain EM specimens were prepared. In the micrographs of the C complexes that had been labeled at exon 1 and incubated with PAG (Fig. 3A, bottom), most of the gold particles were found attached to a C complex. When the biotinylated oligonucleotide was omitted, antibodies cosedimenting with the C complex were not detected (Supplemental Fig. S2C), and, correspondingly, on the micrographs hardly any gold particles were found to contact with the C complex (Fig. 3A, top), demonstrating the specificity of the labeling procedure.
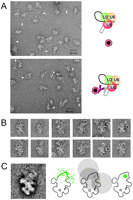
EM localization of an exon 1 position close to the cleaved 5′ splice site in the C complex. Assembled human C complexes were treated successively with biotinylated RNA (“label oligo exon 1”) (Fig. 2B) and antibiotin IgG, then stabilized by the GraFix method, incubated with protein A-coated colloidal gold (PAG), and examined by EM using negatively stained samples (see Materials and Methods). (A) General field of C complexes incubated with PAG either in the absence (upper panel) or presence (lower panel) of the biotinylated oligonucleotide complementary to exon 1. (B) Gallery of PAG-labeled C complexes seen in the dominant view. (C) Superposition of all 87 gold-labeled C complexes used for localization of exon 1, showing the dominant projection (left). All typical structural features of the dominant view can be recognized. The “head” (domain 2) appears blurred as many gold particles are found there (see text). In the schematic outline drawing of the C complex (second from left), all of the positions of gold particles in the C complex images showing the dominant view are indicated. The sketch second from the right shows, as an example, 17-nm circles around three gold particles and the overlap region to which the epitope is assigned. Using the 17-nm rule for all 87 gold labels (Wolf et al. 2009), the biotin of the oligonucleotide positioned approximately in the middle of exon 1 (48 nt upstream of the 3′ end) can be localized to the green area in the head of the C complex (right).
To identify the site to which the PAG-labeled antibody was bound, the method introduced by Wolf et al. (2009) was applied. This takes into account the greatest expected distance of ∼17 nm between the center of the gold label and the antibody binding site, i.e., the maximum separation between them when the combined label is stretched out to its full extent (gold colloid radius, 2.5 nm; Protein A, 2.5 nm; IgG, 12 nm). A prerequisite for using this method is that one obtains an adequate number of gold-labeled C complexes showing the same view on micrographs, i.e., with particles lying on the same side on the carbon film support.
Inspection of about 350 images of gold-labeled particles revealed 87 with the C complex in its characteristic, dominant view. This view was used for all of the localizations presented here. Twelve representative gold-labeled C complexes showing the dominant view are shown in the gallery (Fig. 3B). For verification of the presence of this dominant view, all of the 87 images were superimposed and averaged. The highly enhanced appearance of the typical features of the dominant view in the average (Fig. 3C, left) demonstrates that most of the 87 images show the characteristic view and were oriented correctly. Although the gold particles were masked before averaging, some blurring in the upper region of the C complex images occurs, because of superimposition of the gold with the C complex images in this region. The positions of all gold particles found in images with the characteristic C complex view are marked in the sketch in Figure 3C (middle left). They are all located in the upper region of the C complex, at or beside domain 2.
When bound to the complex, the gold particles will, of course, not always be positioned at the maximum distance (17 nm) from the antibody binding site because of the flexibility of the linker (in particular, of the antibody arms). In addition, the distance will appear shorter if the gold is positioned in a different plane (in the imaging direction) from that of the antibody-bound biotin. Therefore, the possible location of the biotin bound to the antibody cannot be >17 nm from the observed position of the gold but will, in general, be closer than this. Consequently, it must be somewhere within a circle with a 17-nm radius, centered on the position of the gold. To identify the most likely area of biotin localization in the C complex, the 87 images were superimposed, and the gold positions found in all 87 images were combined. The principle is illustrated in Figure 3C (middle right) for three widely separated gold positions. If all 87 gold positions are taken into account, the area overlapped by all circles, with an allowance of an additional error margin of 2–3 nm, defines the most likely region where the antibody-bound biotin is located (Fig. 3C, right, green area). This is, thus, the region where we conclude that the 48th nt upstream of the 3′ end of exon 1 is located.
Location of the intron-lariat sequence proximal to the branch point bound 5′ end of the intron
To locate the intron-lariat sequence, we used the 3′ biotinylated 2′-OMe RNA oligonucleotide, designated “label intron 5′ splice site” (Fig. 2B), that is complementary to the accessible intron sequence close to the cleaved 5′ splice site. In this case, the biotin label is positioned 26 nt downstream from the branch-point-bound 5′ end of the intron. C complex purification and labeling were performed as described above. Images of negatively stained specimens showed that nearly all gold particles were found in close proximity to a C complex (Fig. 4A, bottom), while, in the control experiment lacking oligonucleotide, hardly any gold particles appeared to contact a C complex (Fig. 4A, top).
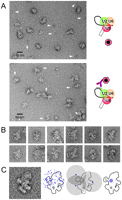
EM localization of an intron position close to the cleaved 5′ splice site in the C complex. Labeling was as described in Fig. 3, except that here the biotinylated label intron 5′ splice site oligonucleotide was used. (A) General field of C complexes incubated with PAG either in the absence (upper panel) or presence (lower panel) of the biotinylated oligonucleotide complementary to the intron close to the 5′ splice site. (B) Gallery of PAG-labeled C complexes seen in the dominant view. (C) Left: Superposition of all 111 gold-labeled C complexes used for locating the intron position close to the cleaved 5′ splice site, showing the dominant projection. All of the typical structural features of the dominant view are seen. Second from left: Outline sketch of the dominant view of the C complex with all gold positions indicated. Third from left: An example of the use of the 17-nm rule for three gold labels. Far right: Using the 17-nm rule for all 111 gold labels, the biotin-labeled nucleotide positioned on the intron close to its 5′ end localizes within the blue area close to domain 6 (labeled) of the C complex.
About 400 gold-labeled C complexes were examined, and, in the case of 111 images, the typical features of the dominant C complex view could be recognized. Twelve of these are shown in the gallery (Fig. 4B). In this case, the gold colloids are found at various positions on and next to the C complex images, particularly on the left side, but not in the lower region. All of the gold positions are shown in Figure 4C (middle left), and the average of the 111 superimposed images (Fig. 4C, left) demonstrates that most of these images, indeed, show the C complex in the dominant view. To localize the biotin label, circles with a 17-nm radius were drawn around every gold position (examples are shown in Fig. 4C, middle right). The position overlapped by all of these circles (extended by a 2- to 3-nm error margin) is located in the lower part of domain 2, close to its interface with domain 1 and more toward the side containing peripheral domain 6 (Fig. 4C, right). Thus, these data indicate that intron nucleotides that are close to the cleaved 5′ splice site (i.e., +26 relative to the intron's 5′ end) are located in this region of the C complex.
Location of the intron-lariat sequence proximal to the anchoring site
Finally, to locate the other end of the intron loop close to the branch point, the 5′ biotinylated 2′-OMe RNA oligonucleotide designated “label intron anchoring site” (Fig. 2B) was added to assembled C complexes, as described above. This oligo binds to the accessible intron nucleotides closest to the anchoring site, and it places the biotin label 44 nt upstream of the branch point adenosine. Antibody binding, complex purification, stabilization by GraFix, and incubation with PAG were performed as above. Negatively stained EM fields again showed that gold particles were nearly always located close to the C complexes but not in the control where the oligonucleotide was omitted (Fig. 5A). About 300 gold-labeled C complexes were examined, and in 49 of these, the typical features of the dominant view could be recognized. Twelve of the latter are shown in the gallery (Fig. 5B), and the superimposed images (Fig. 5C, left) demonstrate the presence of the dominant C complex view in most of the 49 images. With this oligonucleotide, the gold particles are now found mainly in the lower right region of the C complex images (Fig. 5C, middle left). Again, 17-nm circles (examples in Fig. 5C, middle right) were used to locate more precisely the antibody binding site. This shows that the intron nucleotide close to the anchoring site is also located on the main body of the C complex, at the interface between domains 1 and 2, but further down compared to the region defined for the nucleotide near the 5′ end of the intron (Fig. 4C) and further on the side containing peripheral domains 3 and 4 (Fig. 5, right).
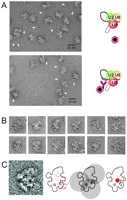
EM localization of an intron position close to the anchoring site in the C complex. Labeling was as described in Fig. 3, except that here the biotinylated “label intron anchoring site” oligonucleotide was used. (A) General field of C complexes incubated with PAG either in the absence (upper panel) or presence (lower panel) of a biotinylated oligonucleotide complementary to the intron just upstream of the anchoring site. (B) Gallery of PAG-labeled C complexes seen in the dominant view. (C) Left: Superposition of all 49 gold-labeled C complexes used for locating the intron position close to the anchoring site, showing the dominant projection. As in Figs. 3C and 4C, all of the typical features are seen. Second from left: Outline sketch of the dominant view with all gold positions indicated. Third from left: An example of the use of the 17-nm rule for three gold labels. Far right: Using the 17-nm rule for all 49 gold labels, the biotin-labeled nucleotide positioned on the intron close to the anchoring site localizes within the red area close to domains 3 and 4 (labeled) of the C complex.
DISCUSSION
In this work, we have localized three sites of the pre-mRNA in the human spliceosomal C complex, which is at the stage between the first and second step of splicing. In this intermediate processing state, the pre-mRNA in the C complex consists of the cleaved exon 1 and the lariat-like circularized intron, and it is believed that the branch site of the intron and the cleaved 3′ end of exon 1 (i.e., the 5′ exon) are at or close to the spliceosome's catalytic center. The three pre-mRNA sites that we have localized by EM represent those nucleotides within exon 1 or the intron lariat loop that are the closest to the catalytic center, while being accessible to long oligonucleotides in the C complex. Accessible sites were identified by an RNase H-based approach, using complementary DNA dodecanucleotides to scan the pre-mRNA sequence in 2-nt steps. Our data and that of others (Reichert et al. 2002; Ilagan et al. 2009) indicate that nucleotides in the catalytic center of the C complex are, for the most part, well protected, thereby precluding the annealing of oligonucleotides directly next to the reactive groups of the pre-mRNA. Bound spliceosomal proteins (in particular at the anchoring site and the polypyrimidine tract), as well as snRNAs (e.g., U6 at the 5′ splice site and U2 at the branch site), are likely responsible for the RNase H protection pattern observed. It was previously shown that even stripping the C complex by incubating with 1 M salt does not lead to displacement of cleaved exon 1 or the lariat intermediate from the complex (Bessonov et al. 2008), indicating that the splicing intermediates are well tethered in the C complex by multiple protein/snRNA interactions. The protected RNA regions are probably the sites that tightly anchor, e.g., the cleaved exon 1 to the C complex. The exon junction complex proteins, several of which are clearly found in the C complex (Bessonov et al. 2008), are also thought to be bound here (Reichert et al. 2002) and may contribute to the observed RNAse H protection of exon 1.
For localization by EM, we employed 2′-OMe RNA oligonucleotides with a biotin at their end, proximal-most to pre-mRNA nucleotides thought to be at the catalytic center. The biotinylated end of the annealed oligonucleotide was located by electron microscopy through binding of antibiotin antibodies followed by colloidal gold covered with Protein A. The individual positions of the gold particles were identified on the gold-labeled C complexes that showed the characteristic dominant view. Although the gold label visible on the micrographs can be as far as 17 nm from the biotin-labeled site in the complex, this site can, nevertheless, be located quite precisely (putatively within 5–6 nm) in a given particle view by combining the gold positions observed at the particles showing this view. The precision with which the antibody-binding site can be defined on the C complex images analyzed increases with the degree of isotropy of the gold-particle distribution around the shared overlapping point. In the case of the intron position close to the cleaved 5′ splice site, the gold positions are the most homogeneously distributed (Fig. 4) and, thus, a relatively small overlapping area—defined by the 17-nm distance constraint—can be demarcated with high confidence. For the exon 1 site, the gold particles are less isotropically distributed in the upper right C complex region; nonetheless, there are enough gold positions in lower, more left regions to define quite well the position of the label by the 17-nm distance criterion. In summary, the three labeling experiments produced three different distributions of the gold labels in the dominant view of the C complex, as can easily be seen by visual comparison of the summary diagrams (Fig. 6). Therefore, the three pre-mRNA sites are located at clearly distinct positions in the C complex.
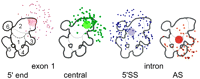
Summary of the results of all four gold-labeling, EM investigations of the human C complex. From the left: The position of gold particles is shown for labeling of the 5′ end of exon 1 (Golas et al. 2010); exon 1, close to the cleaved 5′ splice site (central); the intron, close to the cleaved 5′ splice site (5′SS); and the intron, close to the anchoring site (AS).
In a previous study by Golas et al. (2010), the 5′ end of exon 1, which is expected to be more remote from the catalytic center, was localized in the C complex by EM using the MS2-hairpin approach coupled with an MBP-specific antibody and gold labeling. Similar to the central exon position defined here using the “label intron 5′ splice site” biotinylated oligonucleotide, the gold particles were also found clustered around domain 2 but clearly oriented more toward the top (Fig. 6, left). Thus, the antibody-binding region, and consequently the 5′ end of exon 1, are located further toward the top of the C complex.
The localization of four distinct pre-mRNA sites now allows first insights into the path of the pre-mRNA within the functional C complex. As shown in the proposed model in Figure 6B, the cleaved exon 1 runs from the upper periphery of the complex, where its 5′ end localizes (Fig. 7B; Golas et al. 2010) downward to domain 2, passing the position where the central sequence of exon 1 was localized (Fig. 3). Its 3′ end should be found in the catalytic center, as the 3′-OH of the cleaved exon 1 acts as the nucleophile for the second splicing step. The branch point adenosine is also likely still present at the catalytic center, even though it is no longer needed for step 2. As it has just acted as the nucleophile for step 1, attacking the phosphodiester bond of the 5′ splice site, leading to cleavage at this site, it is depicted still in close proximity to the resultant 3′ end of exon 1. In our proposed model, the 5′ end of the intron (bound to the branch adenosine via a 2′,5′ phosphodiester bond) runs from the branch point toward domain 6 to the left, while the anchoring site sequence runs to the bottom right, toward domains 3 and 4 (Fig. 7B). How the intron continues to close the loop is presently not clear. The intron might even be flexible in this region, as it is completely accessible and also because its complete removal does not result in a detectable structural change (E Wolf, P Odenwälder, P Dube, B Kastner, and R Lührmann, unpubl.). The most likely position of the catalytic center would be within an area encircled by the three pre-mRNA positions defined by this study, as they theoretically should be located not far from the catalytic center. Based on our model, this would encompass the side of the interface region between domains 1 and 2, which faces domain 3.
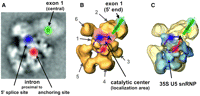
Proposed path of the pre-mRNA in the human C complex. (A) Class average of EM images of the C complex in the dominant view, showing the pre-mRNA positions located in this work. (B) Projection of all four localized pre-mRNA sites onto the 3D structure of the C complex as reconstructed by Golas et al. (2010). The location of the 5′ end of exon 1 is taken from Golas et al. (2010), as is their proposed area of the catalytic center (pink area). A possible position of the branch-point adenosine (that fits the localization data), as well as a likely path of the pre-mRNA splicing intermediates, is superimposed on the structure. The numbers indicate the structural domains of the C complex. (C) Locations and path of the pre-mRNA, as in B but projected onto the 3D structure of complex C showing also the fitted 3D structure of the 35S U5 snRNP (from Golas et al. 2010).
Golas et al. (2010) have recently shown that most of the lower part of the C complex structure is composed to a large degree of 35S U5 snRNP components, as the 3D structure of the 35S U5 snRNP could be fitted very closely and unambiguously into the lower part of the C complex 3D structure (Fig. 7C). The 3D structure of the salt-washed C complex could also be fitted well into the intact C complex, and domains of it not encompassed by the 35S U5 snRNP were identified (Golas et al. 2010). Although the 35S U5 snRNP contains several components expected to be close to the catalytic center (U5 snRNA and the proteins Prp8, Snu114, Brr2), it lacks most of the pivotal components such as the pre-mRNA and U2 and U6 snRNAs. As these RNAs are present in the salt-washed C complex, they are expected to be located in a structural domain of this complex that is not present in the 35S U5 structure. In the intact C complex, this structural domain should be close to the part of the 35S U5 that contains components of the catalytic center. On the basis of these assumptions, Golas et al. (2010) identified a structural domain at the front of the C complex (seen in the preferred view) within the interface region of domains 1 and 2 as the most likely region for the location of the catalytic center (Fig. 7B, pink area). The position of the catalytic center, as derived from our labeling data, fits very well into this region. Moreover, our data would suggest that the catalytic center may be limited more to the right-hand half of this pink region, close to domain 3.
Transfer of our localization regions of the two intron positions to the 35S U5-fitted C complex shows that these positions are located at, or close to, the upper interface of the 35S U5 part within the C complex (Fig. 7C). As the U6 snRNA in the C complex base-pairs with intron nucleotides of the 5′ splice site, it should, according to our labeling results, be located more on the left at the 35S U5 interface, while the branch point base-paired U2 RNA should be more on the right.
A prerequisite for understanding the architecture of the C complex, and in particular of the design of its catalytic center, is knowledge regarding the topography of its protein composition. Immuno-EM localization of key components of the C complex and, moreover, of the 35S U5 snRNP, would be of great importance. The topography of the pre-mRNA, as described here, could provide a basis for interpreting future protein localization data obtained by EM.
MATERIALS AND METHODS
C complex assembly and RNase H protection assay
Human spliceosomal C complexes were assembled on uniformly 32P-labeled PM5 pre-mRNA (Bessonov et al. 2008) that had been synthesized and m7G(5′)ppp(5′)G-capped in vitro as described earlier (Hartmuth et al. 2002) and that contained three MS2-binding sites at its 5′ end. C complexes were assembled in 50% (v/v) HeLa nuclear extract, prepared as described previously (Behzadnia et al. 2006), in a splicing reaction containing 65 mM KCl, 3 mM MgCl2, 2 mM ATP, 20 mM creatine phosphate, and 15 nM 32P-labeled pre-mRNA. Splicing reaction mixtures were incubated for 150 min at 30°C. Afterward, screening for accessibility was performed by adding dodecadeoxyribonucleotides to a concentration of 1.5 μM to the splicing reaction and by incubating for an additional 30 min at 30°C. RNA was recovered and separated by polyacrylamide gel electrophoresis (10% w/v polyacrylamide, 50% w/v urea). Bands were visualized by autoradiography and subsequently by staining with silver.
MS2 affinity selection of spliceosomal C complexes
Before complex assembly, PM5 pre-mRNA was incubated with a 20-fold molar excess of purified MS2-MBP fusion protein (Zhou et al. 2002) and, subsequently, an 18-mL splicing reaction was carried out. After assembly, complexes formed prior to C were degraded by incubating for 20 min with DNA oligonucleotides directed against the 3′ end of the 5′ exon (Bessonov et al. 2008). Complexes were separated on 10%–30% (v/v) glycerol gradients, and 40–45 S gradient fractions were subjected to affinity selection on amylose beads as described previously (Bessonov et al. 2008).
Oligonucleotide labeling and immunocomplex preparation for electron microscopy
For localization of pre-mRNA positions within the spliceosomal C complex, we used 30-mer 2′-OMe RNA oligonucleotides complementary to exon 1 nucleotides (“label oligo exon 1”) and the intron (“label oligo intron 5′ splice site,” and “label oligo intron anchoring site”) (Fig. 2B). After C complex assembly under splicing conditions in HeLa nuclear extract, these oligonucleotides were added in a 30-fold molar excess over the pre-mRNA and incubated for a further 30 min at 30°C. After the first gradient centrifugation, antibiotin antibody (100-4198, Rockland) was added to the C complex containing gradient fractions in a 30-fold molar excess and incubated for 90 min at 4°C before affinity selection on amylose beads. Labeling was controlled and optimized by analyzing immunocomplex formation by gradient centrifugation and ELISA, as described earlier (Wolf et al. 2009): Briefly, immunocomplexes were separated from free antibodies via gradient centrifugation, and the gradient was fractionated and fractions containing C complexes were identified by the distribution of 32P-labeled pre-mRNA. To determine whether the antibodies comigrate with the C complex (indicating immunocomplex formation), rabbit-IgG-detecting ELISA was performed.
Electron microscopy of labeled C complexes
Antibiotin labeled or control C complexes (5 pmol in 400 μL) eluted from the amylose beads were loaded onto a 4.4-mL linear 10%–30% (v/v) glycerol gradient and centrifuged for 107 min at 60,000 rpm in a TH-660 rotor (Thermo Scientific). The glycerol gradient also contained a linear gradient of 0%–0.1% glutaraldehyde (25% aqueous solution, EM grade, EMS), to stabilize the complex by chemical cross-linking (GraFix method) (Kastner et al. 2008). Under these conditions, the Protein A-binding capacity of the IgG antibody bound to the C complex is maintained. The gradient was harvested from the bottom (35 fractions of ∼120 μL each). For subsequent gold-labeling, the cross-linking reaction was stopped immediately after fractionation by adding 10 μL of 1 M glycine-NaOH, pH 7.9, to each fraction and incubating for 30 min at 4°C. Gradient fractions containing C complexes, as determined by the distribution of 32P-labeled pre-mRNA, were pooled and incubated with colloidal PAG (G. Posthuma, Cell Microscopy Center, University Medical Center Utrecht). Approximately 0.1 μL of colloidal gold solution was mixed with 100 μL of C complexes (∼200 fmol C complexes, ∼100 fmol gold colloid). This mixture was incubated at 4°C for 90 min and then used directly for EM grid preparation, as described by Golas et al. (2003), but with a prolonged particle-adsorption period of 2 h. Images were obtained at room temperature at a magnification of 105,000 on a calibrated CM200FEG electron microscope (FEI) in eucentric height at a defocus of ∼1.5 μm. The microscope was equipped with a TemCam F224A digital camera (TVIPS). Gold-labeled particles were grouped into similarity classes by visual inspection.
SUPPLEMENTAL MATERIAL
Supplemental material is available for this article, showing additional results of the pre-mRNA accessibility mapping by the RNase H assay (Supplemental Fig. S1) and the specificity of the antisense oligonucleotide labeling (Supplemental Fig. S2) of the spliceosomal C complex.
ACKNOWLEDGMENTS
We thank Thomas Conrad, Hossein Kohansal, and Irene Öchsner for excellent technical assistance. We also thank Prakash Dube and Holger Stark for help with EM, Sergey Bessonov for help with C complex preparation, and Cindy L. Will for very helpful comments on the manuscript. This work was supported by a grant from the Studienstiftung des deutschen Volkes to E.W. and a grant from DIP-German-Israeli Project-Cooperation to R.L.
Footnotes
-
↵2 Corresponding authors
E-mail reinhard.luehrmann{at}mpi-bpc.mpg.de
E-mail bkastne{at}gwdg.de
-
Article published online ahead of print. Article and publication date are at http://www.rnajournal.org/cgi/doi/10.1261/rna.033910.112.
- Received April 16, 2012.
- Accepted April 23, 2012.




