


Transcriptomic profiling of the oyster pathogen Vibrio splendidus opens a window on the evolutionary dynamics of the small RNA repertoire in the Vibrio genus
- Claire Toffano-Nioche1,
- An N. Nguyen1,
- Claire Kuchly,
- Alban Ott,
- Daniel Gautheret,
- Philippe Bouloc and
- Annick Jacq2
- Institut de Génétique et Microbiologie, CNRS/UMR 8621, IFR115, Université Paris-Sud, Bâtiment 400, 91405 Orsay Cedex, France
-
↵1 These authors contributed equally to this work.
Abstract
Work in recent years has led to the recognition of the importance of small regulatory RNAs (sRNAs) in bacterial regulation networks. New high-throughput sequencing technologies are paving the way to the exploration of an expanding sRNA world in nonmodel bacteria. In the Vibrio genus, compared to the enterobacteriaceae, still a limited number of sRNAs have been characterized, mostly in Vibrio cholerae, where they have been shown to be important for virulence, as well as in Vibrio harveyi. In addition, genome-wide approaches in V. cholerae have led to the discovery of hundreds of potential new sRNAs. Vibrio splendidus is an oyster pathogen that has been recently associated with massive mortality episodes in the French oyster growing industry. Here, we report the first RNA-seq study in a Vibrio outside of the V. cholerae species. We have uncovered hundreds of candidate regulatory RNAs, be it cis-regulatory elements, antisense RNAs, and trans-encoded sRNAs. Conservation studies showed the majority of them to be specific to V. splendidus. However, several novel sRNAs, previously unidentified, are also present in V. cholerae. Finally, we identified 28 trans sRNAs that are conserved in all the Vibrio genus species for which a complete genome sequence is available, possibly forming a Vibrio “sRNA core.”
Keywords
INTRODUCTION
Orchestration of transcriptional and post-transcriptional regulatory networks is crucial for bacteria to maintain their homeostasis and to adapt to changing growth conditions. Regulatory small RNAs (sRNAs) are key elements of these regulations. They are generally noncoding with a size ranging from 50 to 300 nt and can either (i) target proteins or (ii) base-pair with RNAs to perform their function (for review, see Gottesman and Storz 2011). In the first group, CsrB is an example of sRNAs that affect glycogen synthesis in Escherichia coli by titrating the regulatory RNA-binding protein CsrA, itself a translation inhibitor, whereas 6S RNA mimics a transcriptional open complex that traps the RNA polymerase associated with σ70 (Wassarman and Storz 2000). The second group of RNA-targeting sRNAs is conventionally subdivided in two subcategories. The first comprises noncoding RNAs (ncRNAs) transcribed from genes that are on the complementary strand of the target gene; they are defined as cis-antisense RNAs (asRNAs) (for review, see Brantl 2007; Georg and Hess 2011). Consequently, asRNAs and their targets form perfect extended duplexes, involving either the coding or the untranslated regions (UTRs) of the regulated mRNA. Recently, asRNAs were identified as repressors of the expression of small hydrophobic proteins that are toxic at high levels; these mRNA/asRNA pairs have been classified as type I toxin–antitoxins (for review, see Fozo et al. 2008).
The second subcategory comprises the much studied bacterial sRNAs, which are expressed from genes located between two coding sequences (CDSs) and target mRNAs expressed from genes at different genomic locations, which can be referred to as trans-encoded regulatory RNAs (sRNAs). These sRNAs associate with their targets with limited base-pair matches. The first identified example of such an sRNA in E. coli was MicF, which targets the outer membrane porin OmpF mRNA (Mizuno et al. 1984).
Bacterial sRNAs frequently pair with the 5′ end of their target mRNA. One possible outcome is translation activation, the interaction leading to a remodeling of a secondary structure in the mRNA that blocked the ribosome-binding site. However, in many cases, the interaction leads to translation inhibition and/or mRNA degradation (for review, see Gottesman and Storz 2011). In several bacteria, the regulatory activity of trans-encoded sRNAs requires the RNA chaperone Hfq (for review, see Vogel and Luisi 2011). sRNAs regulate a wide variety of processes including secretion, iron homeostasis, carbohydrate and intermediate metabolism, central metabolism, quorum sensing, stress responses, and virulence (for review, see Gripenland et al. 2010; Gottesman and Storz 2011).
Finally, a few highly conserved bacterial sRNAs are not regulatory and perform important housekeeping functions: tmRNA, RNase P RNA, and the SRP component, 4.5S RNA.
Another category of regulatory RNA comprises 5′ untranslated regions of mRNAs (r5′UTRs) displaying alternative structures according to environmental conditions. These elements sense a wide range of signals including uncharged tRNAs (T-box), various metabolites (riboswitches), metal ions, and pH and temperature (RNA thermosensors). The RNA conformational changes affect the downstream sequence, modulating its expression either through transcription attenuation or a translational block. In addition, long 5′ UTRs can correspond to leader sequences playing a role in attenuation or be targets of trans-encoded sRNAs (for review, see Geissmann et al. 2009; Smith et al. 2010).
Over the years, extensive knowledge of sRNAs has been gained in enterobacteriaceae, especially in the model organism E. coli. For instance, in a recent report, Skippington and Ragan (2012) list 44 sRNAs with known targets in E. coli. Comparatively, in the Vibrio genus, still a limited number of computational and experimental studies were carried out to identify sRNAs, mostly in Vibrio cholerae and Vibrio harveyi. They uncovered highly conserved small RNAs such as tmRNA, 6S RNA, RNase P, and 4.5S RNA, as well as certain regulatory sRNAs found in other genera. In particular, V. cholerae contains three copies of the CsrB family sRNAs (CsrB, C, and D), which are regulated by quorum sensing and whose expression affects virulence and biofilm formation by titrating the translational inhibitor CsrA (Lenz et al. 2005).
Another conserved sRNA, RhyB, initially described in E. coli (Masse et al. 2005) and regulating iron storage, was also characterized in Vibrios (Davis et al. 2005; Mey et al. 2005). Many sRNAs are genus- or order-specific, and among them are Qrr sRNAs, found, so far, only in vibrionales (Lenz et al. 2004). V. cholerae and V. harveyi genomes have four and five qrr paralogs, respectively, that either redundantly or additively control quorum sensing and quorum-sensing-regulated virulence genes (Tu and Bassler 2007).
More recently, several sRNAs have been identified and specifically characterized in V. cholerae. MicX regulates the expression of VC0972, which encodes an outer membrane protein of uncharacterized function (Davis and Waldor 2007). VrrA regulates expression of the outer membrane proteins OmpA and OmpT, modulates colonization, and affects release of outer membrane vesicles (Song et al. 2008, 2010). TarA is regulated by ToxT, a transcriptional activator of the cholera toxin gene, and targets the ptsG transcript, thus influencing glucose uptake (Richard et al. 2010). Finally, the chitin-induced small RNA TfoR, which regulates the translation of tfoX, a positive regulator of natural competence, was recently described (Yamamoto et al. 2011).
Several global searches for sRNAs in V. cholerae were also performed. A first integrative computational approach relying on intergenic sequence conservation and presence of a Rho-independent terminator led to the experimental validation of six new sRNAs (Livny et al. 2005). However, because sRNAs are generally not conserved beyond closely related species, these computational screens have been quickly outpaced by high-throughput sequencing efforts (Croucher and Thomson 2010). cDNA sequencing of V. cholerae size-selected small regulatory RNAs (sRNA-seq) using the 454 technology allowed the identification of 500 putative trans-encoded sRNAs and 127 putative asRNAs (Liu et al. 2009). Nonetheless, as also noted by others (Raabe et al. 2011), many candidates correspond to variants of the same RNA, and collapsing such variants into single transcripts results in 269 potential sRNAs encoded in intergenic regions (IGRs; our own analysis of their results). Finally, Raabe et al. (2011) described the detection of 223 noncoding RNAs by conventional cDNA library construction and sequencing, the majority of them having not been detected by Liu et al. (2009). In a genome-wide approach, Bradley et al. (2011) used sRNA-seq and a ToxT chromatin immunoprecipitation (ChIP-seq) to identify ToxT-regulated sRNAs. This led in particular to the identification of TarB, which targets the secreted colonization factor TcpF (Bradley et al. 2011). TarB was also identified by Davies et al. (2012), using ToxT ChIP-seq following overproduction of ToxT. Using RNA-seq, Mandlik et al. (2011) identified genes whose expression was modulated in two animal models of infection, including genes coding for sRNAs, thus identifying 77 putative new sRNAs (Mandlik et al. 2011).
No global experimental study has yet addressed the question of small regulatory RNAs in other Vibrios than V. cholerae and V. harveyi, neither their potential role in virulence. The recent reports of the role of Hfq in virulence in the human pathogen Vibrio parahaemolyticus as well as in the fish pathogen Vibrio alginolyticus underscore the likeliness of the importance of sRNAs in virulence in these other species (Nakano et al. 2007, 2008; Liu et al. 2011).
Although certain Vibrio species, such as V. cholerae, Vibrio vulnificus, and V. parahaemolyticus are human pathogens, the vast majority are commensals or pathogens of fish and shellfish and cause major economic losses in aquaculture. In those species, sRNAs are also likely to play an important role in virulence. Exploring the diversity and specificity of sRNAs in Vibrios affecting various hosts and/or colonizing various niches may lead to a better appreciation of their role in host/niche adaptation. As a first step in this direction, we decided to explore the sRNA repertoire of Vibrio splendidus. This Vibrio has been associated with major oyster summer mortality outbreaks over the past 15 years (Gay et al. 2004a), and the strain V. splendidus LGP32 causes mortalities when injected to oysters (Gay et al. 2004b; Le Roux et al. 2007). The genome of V. splendidus was sequenced (Le Roux et al. 2009), and several potential virulence factors were identified (Binesse et al. 2008; Duperthuy et al. 2010). The genome is nearly 5 Mb, 20% larger than that of V. cholerae, and V. splendidus chromosome II is 56% larger than its V. cholerae counterpart, indicating the possibility of many new sRNAs being present in this species. In addition, genetic tools are now available to work in V. splendidus (Le Roux et al. 2007).
In this study, we determined the full transcriptome of V. splendidus growing exponentially in rich medium using an Illumina-based cDNA deep-sequencing technology (RNA-seq). Reads were mapped at nucleotide resolution, and we extracted from the data a comprehensive list of intergenic transcripts and classified them into putative sRNAs and r5′UTRs, whereas putative asRNAs were extracted from the list of antisense transcripts. The comparison of the resulting lists with other sequenced Vibrio genomes and transcriptomes sheds lights on the repertoire and conservation of regulatory RNAs in the vibrionaceae, thus allowing a first tentative definition of a core set of Vibrio sRNAs and paving the way to a better understanding of the evolutionary dynamics of regulatory RNAs in this bacterial family.
RESULTS
Data generation by cDNA deep sequencing
One of our objectives was to establish an extensive repertoire of V. splendidus regulatory RNAs. To approach natural conditions, cells were grown in marine salt medium at 20°C (see Materials and Methods). Because many regulatory RNAs are expressed only in specific conditions, we pooled RNA samples from six different time points during growth, from early exponential growth to entry into stationary phase (Supplemental Fig. S1).
Given the depth of analysis provided by Illumina sequencing, we considered that no specific enrichment for small RNAs (which may introduce biases) was necessary and that useful, additional information could be obtained from the analysis of the full transcriptome. Hence, although our focus is on sRNAs, we performed the sequencing of the complete transcriptome (RNA-seq).
To increase the depth of our analysis, and since 16S and 23S rRNAs can represent >95% of a total RNA preparation, we carried out an rRNA depletion step using an exonuclease that degrades 5′-P RNAs (rRNAs and tRNAs processed from longer transcripts) but not 5′-PPP RNAs, corresponding to primary transcripts (Materials and Methods).
A characteristic of vibrionales is the presence of two circular chromosomes. In V. splendidus, chromosome I is 3,299,303 nt long, whereas chromosome II is 1,675,515 nt. After filtering the reads of insufficient quality, we obtained from the RNA-seq experiment 28.6 M usable reads, of which 2.4 M (8.40%) failed to align to the genome. 21.6 M (75.39%) aligned to multiple loci and were suppressed from subsequent analyses. 4.1 M (14.27%) and 0.56 M (1.94%) mapped at unique positions on chromosome I and chromosome II, respectively. The majority of non-uniquely mapping reads correspond to rRNA and tRNA sequences, their high proportion indicating a limited efficiency of the primary transcript enrichment procedure. They can also correspond to a lesser extent to repeated sequences such as IS and transposase genes.
For both chromosomes, nearly half of the reads mapped to annotated genes, and half to IGRs. Only 0.4% (chromosome I) and 1.31% (chromosome II) mapped in antisense to annotated genes (see below). Table 1 presents a summary of these results.
Summary of the Illumina RNA-seq data in the context of the V. splendidus genome
The two chromosomes have different expression levels
Average coverage per nucleotide was found to be a little less than four times higher for chromosome I than chromosome II (Table 1), indicating that chromosome II tends to be less expressed than chromosome I in the condition assayed. This difference is underestimated, since the expression of rRNA operons, which are highly expressed and are mostly located on chromosome I, is not included in this count. Gene expression levels were also normalized using RPKM values (“reads per kilobase of feature per million mapped reads”; see Materials and Methods). Not only does chromosome II have a lower overall expression level (average CDS expression of 51 RPKM to compare with 327 RPKM for CDSs on chromosome I), but it also harbors more genes with no or very low expression than chromosome I: 9.2% of protein-coding genes on chromosome II had zero RPKM, 19.8% had <2 RPKM, compared with 5% and 12.5%, respectively, for chromosome I (Table 1).
Chromosome replication starts from the origin of replication and proceeds bidirectionally toward the terminus of replication. As in other rapidly growing bacteria such as E. coli, V. cholerae, and V. parahaemolyticus (Rocha 2004; Dryselius et al. 2008), we observed in V. splendidus that highly expressed genes in chromosome I were preferentially transcribed from the leading strand and tend to cluster toward the origin of replication, away from the terminus region (Fig. 1). In contrast to chromosome I, expressed genes from chromosome II are more evenly distributed between the leading and lagging strand, and strongly expressed genes can be found in the vicinity of the terminus of replication (Fig. 1).
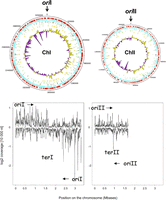
V. splendidus genome expression levels along chromosomes. (Top) Schematic circular diagrams of V. splendidus chromosomes I and II. Keys to the chromosomal circular diagrams (outside to inside): scale (in nucleotides): + strand CDS (red), − strand CDS (blue), position of sRNAs (dark green), r5′UTRs (light green), asRNAs (orange), log2 of coverage per nucleotide, averaged on a window of 10,000 for the + strand (olive green) and for the − strand (purple). The position of the origin of replication for both chromosomes is indicated (nt 0). (Bottom) Linear representation of log2 coverage (expressed as read numbers per a sliding window of 10,000 nt) along both chromosomes. The arrows indicate the sense of propagation of the replication forks from the origin of replication to the terminus of replication.
Transcript assembly and classification
We clustered reads into potential transcripts and classified those clusters into three classes corresponding to potential regulatory RNAs (see Materials and Methods): trans-encoded sRNAs, cis-acting 5′-UTR regulatory elements (r5′UTRs, including known or putative novel riboswitches), and cis-encoded antisense RNAs (asRNAs). A schematic view of the criteria used to define each class of clusters/transcripts and a summary of the bioinformatic workflows are presented in Figure 2, A and B, respectively.
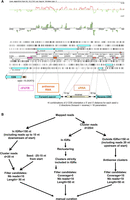
Visualization interface and models for the three kinds of sRNA candidates. (A) We used the Artemis sequence editor tool to check the regulatory RNA candidates manually. We added two tracks to the Artemis classical view of genomic information: the ln of read coverage track (top) and the BamView of the mapped reads (middle). Forward sequences and reverse sequences are above and under the line, respectively. (White boxes) CDSs; (blue boxes) annotated proteins; (pink boxes) cis-encoded r5′UTRs; (orange boxes) cis-encoded asRNAs; (salmon boxes) trans-encoded sRNAs. Models for parameter definition are diagrammatically outlined for each category of regulatory RNAs under the Artemis window. See Materials and Methods and Results sections for details. (B) Schematic representation of the different steps in script execution. r5′UTR, sRNA, and asRNA computational workflows are depicted, respectively, by the left, middle, and right pathways. Most of the steps are managed using one or more S-MART tools. (Nb reads) Number of reads; (d) distance below which two clusters of overlapping reads are merged.
Following manual examination of the script results, comparing them with the visualization of the reads in the context of genome annotations, a final curated list was established for each category and each chromosome, which is provided in Supplemental Table S1. This manual, expert curation of the results led to the validation of 89% of the predicted r5′UTRs, 93% of the predicted trans sRNAs, and 95% of the predicted asRNAs. Nonvalidated transcripts were mostly those judged to correspond to operonic transcripts because of continuous transcription with the surrounding CDSs. In addition, we did not include in the lists clusters corresponding to the 5′ region of rRNA transcripts, as well as tRNA clusters. Additional manual curation included reassignments of certain transcripts to another category (see below for more detailed examples of such reassignments). In the case of sRNAs, manual inspection of the data led also to the discovery of 11 candidates (4.4%) that had not been detected by the script, including CsrB2, which was missed because it encodes a small ORF that was annotated in the genome (see below).
A prior search of the entire genome for known sRNAs using Rfam 10.1 had identified 18 cis-regulatory RNAs, including 11 riboswitches and three amino acid operon leaders, and 19 trans sRNAs, a set to which we added the recently described TfoR sRNA (Yamamoto et al. 2011). TarB (Bradley et al. 2011; Davies et al. 2012), although present in several Vibrios, is absent in V. splendidus.
Out of these 18 cis- and 20 trans-regulatory RNAs, 12 cis (66%) and 12 trans (60%) were detected by the scripts in the appropriate category. Two riboswitches were predicted as trans, and two trans sRNAs were predicted as cis RNAs. Three r5′UTRs and four sRNAs were not detected because of absence of expression.
We describe below in more details the results for each RNA category.
Regulatory 5′ UTR RNAs (r5′UTRs)
In this category, we included riboswitches or operon leaders, which can exist as discrete transcripts, as well as any long 5′ UTR that could be involved in the downstream gene/operon regulation, including at the translational level. We considered that 5′ UTRs that were longer than 50 nt were good candidates to correspond to such regulatory cis-acting RNAs (r5′UTRs). Using such a definition, we identified 471 putative r5′UTRs from this transcriptomic study (Supplemental Table S1).
The glycine and one TPP riboswitches, detected by our pipeline as trans-encoded sRNAs, because they terminated >30 nt upstream of the start codon of the downstream gene, were moved to the “cis” list (Supplemental Table S1).
Some known bacterial r5′UTRs such as a cobalamin riboswitch and histidine and tryptophan operon leaders (Rfam 10.1 RF00174, RF00513, and RF00514, respectively) are absent from our list because of no or insufficient expression (Supplemental Table S1), whereas one r5′UTR was missed because it was in an IGR <150 nt (Alpha operon ribosome binding site: Rfam RF00140) (Schlax et al. 2001) (Materials and Methods).
t44 is an sRNA of unknown function identified in E. coli in a transcriptomic study using tiling microarrays (Tjaden et al. 2002). In our study, this RNA is part of a single transcription unit covering t44, rpsB (VS_2353), encoding ribosomal protein Rps2, and tsf (VS_2352), encoding elongation factor Ts. Northern blots identified two transcripts corresponding to the same transcription start site and two different terminators (Fig. 3). This result confirms the proposal by Aseev et al. (2008) that t44 corresponds to a conserved cis-acting 5′-UTR regulatory element involved in the autoregulation of rpsB by Rps2. These transcripts were found to be less expressed upon entry into stationary phase, as might be expected for a transcript encoding a ribosomal protein (Fig. 3). In V. cholerae, Livny and Waldor (2010) identified 69 r5′UTR candidates from the cDNA deep-sequencing data set generated by Liu et al. (2009). In agreement with our results, t44 was among their candidates.
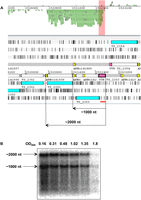
t44 is an r5′UTR. (A) An Artemis window showing expression of the t44 sRNA (pink box) as the 5′ UTR of genes VS_2353 and VS_2352. The read cluster corresponding to the 5′-UTR part of the transcript (t44) is highlighted in salmon. (Yellow boxes) ARNold prediction of Rho-independent transcription terminators (see Materials and Methods). (Blue boxes) Annotated CDS. The orange line underneath indicates the position of the oligonucleotide probe used for the Northern blot. (B) Northern blot of t44. Total RNA samples were prepared from different time points during growth of V. splendidus in marine salt medium at 20°C and submitted to electrophoresis on an agarose gel before transfer to a Hybond N+ membrane. The culture OD600 for each sample is indicated above each lane. The membrane was hybridized with a [γ-32P]ATP-labeled oligonucleotide probe (Supplemental Table S2; Panel A for the position of the probe). The approximate size of the bands (determined by comparison with the position of RNA markers of known size) is indicated on the left.
In addition, 23 of our r5′UTR candidates overlap with these V. cholerae candidates, on the basis of conservation of the downstream gene (Supplemental Table S1_cis). Seven of these 23 are potential or known (S15 leader) cis regulators of ribosomal protein genes. Other genes of note with potentially conserved cis regulation are rne, encoding RNasE (Casaregola et al. 1992), tig, encoding Trigger factor (Kramer et al. 2004), and chiP, encoding a chitoporin (Keyhani et al. 2000). In addition, two GEMM riboswitches (responding to the second messenger c-di-GMP) were also detected in that study. However, none of them were upstream of tfox-2, the gene encoding a paralog of TfoX, itself a regulator of natural competence in Vibrios (Yamamoto et al. 2010), as is the V. splendidus GEMM RNA motif. Indeed, a GEMM motif exists in V. cholerae upstream of the homolog of tfox-2, VC1722 (Sudarsan et al. 2008), but was not detected by Livny and Waldor (2010).
Trans-encoded sRNAs
We identified 250 transcripts as trans-encoded sRNA candidates, 150 encoded on chromosome I, and 100 on chromosome II, respectively (Supplemental Table S1_trans). It should be noted that practically no expression of the four copies of the well-characterized Vibrio Qrr sRNAs (see, for instance, Shao and Bassler 2012) was detected in our study. This absence of expression was confirmed by RT-PCR (data not shown). Accordingly, they are not included in the list of the 250 sRNAs identified by RNA-seq (Supplemental Table S1). Two known sRNAs (i.e., one CsrB and 6S RNA) that ended close to their downstream gene were moved from the r5′UTR list to the sRNA “trans” list. In the case of V. cholerae, 6S RNA was also found in the r5′UTR candidate list of Livny and Waldor (2010).
A homolog of P26 (Rfam 10.1 RF00630), an RNA of unknown function initially described in Pseudomonas aeruginosa (Livny et al. 2006), is found between the genes encoding the ribosomal protein L7/L12 (rplG-rplL) and the β-subunit of the RNA polymerase (rpoB), which corresponds to the same IGR where P26 is located in other genomes. In V. splendidus, this region encompasses <150 nt. In our transcriptomic study, the P26 RNA expression could not be discriminated from the overall transcription of the two flanking genes, suggesting that P26 is a part of an operon transcript that comprises rpsL and rpoB. Northern blotting using an oligonucleotide complementary to P26 as a probe (Supplemental Table S2) showed a complex pattern of expression with several bands of 3.6, 2.5, 1.5, and 1.2 kb (data not shown).
We examined the size and expression pattern of a set of 11 randomly chosen sRNA candidates by Northern blots. Out of these, four gave no signals. Two (Vsr130, 139) gave multiple bands corresponding to higher sizes than deduced from the RNA-seq data (Fig. 4; data not shown). In the case of Vsr130, we observed two bands whose respective amounts were inversely correlated, suggesting that the lower band results from the processing of the higher band (Fig. 4). Vsr45, Vsr262, Vsr300, and Vsr320 gave each a single band. Each candidate displayed a growth-phase-dependent specific pattern of expression. The RNA sizes determined by Northern blots were in good agreement with the sizes deduced from the RNA-seq experiment, except for Vsr320: Its apparent size of 80 nt in the Northern blot is smaller than the size of the read cluster (Supplemental Fig. S2). In this case, the discrepancy can be explained by an artifact of the clustering method. Finally, expression of eight more sRNAs out of eight that were tested was confirmed by RT-PCR (see Materials and Methods), including one (Vsr182) that had not been detected in Northern blots (Fig. 5). Vsr50, 178, and 266 displayed growth-phase-independent expression. Vsr165 was slightly more expressed at mid-exponential phase, and Vsr1, 182, and 268 were maximally expressed upon entry into stationary phase, whereas Vsr261 expression was maximal at early exponential phase.
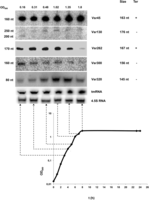
Expression analysis of sRNAs by Northern blots. Total RNA samples were prepared from different time points during growth of V. splendidus in marine salt medium and submitted to electrophoresis on an 8% acrylamide gel before transfer to a Hybond N+ membrane. The culture OD600 for each sample is indicated above each lane, and the growth curve is presented underneath. Membranes were probed with [γ-32P]-labeled specific oligonucleotides for each candidate sRNA (Supplemental Table S2). The name of the sRNA is indicated on the right as well as the size of the transcript visualized in the RNA-seq. The right-most column indicates the presence of a transcription terminator predicted by ARNold (see Materials and Methods). (On the left) The approximate size determined by comparison with the migration of RNAs of known sizes. 4.5S RNA and tmRNA were used as loading controls.
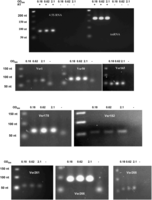
Confirmation of the existence of sRNAs by RT-PCR. Total RNA samples were prepared as described from cells taken from three time points of growth. The corresponding OD600 is indicated above each lane. RNA samples were used as templates for reverse transcription and amplification by PCR (see Materials and Methods) with specific forward and reverse primers (Supplemental Table S2), and the amplification products were subjected to agarose gel electrophoresis together with known size DNA markers (Fermentas). The sizes are indicated on the left side of each panel. (Top panel) RNA samples were checked for complete removal of genomic DNA, using primers specific to 4.5S RNA and tmRNA. When reverse transcriptase (RT) was omitted, no product could be detected. For each sRNA to be tested, a control was run with no template added (labeled -, on top of the lane). Each gel picture is labeled with the name of the tested sRNA.
Small peptides (typically less than 50–60 amino acids) are often difficult to predict by bioinformatics methods relying on statistical biases observed in coding genes present on a given genome. Some small intergenic transcripts could correspond to small open reading frames (ORFs), encoding messages that had been missed by the annotation programs. Accordingly, we examined the potential overlaps of CDSs predicted in the genome by Glimmer and GeneMarkHMM (see Materials and Methods) with our list of sRNAs. Out of 19 potential CDSs encoded by these small RNAs, five were predicted by both programs. For each of these 19 CDSs, we looked for conservation using BLASTP and examined the potential ribosome-binding sites (RBS). Five were predicted to encode small peptides conserved in other closely related Vibrios and judged more likely to correspond to protein-coding genes than to sRNAs. Three of these transcripts have canonical RBS, and four of the encoded peptides are predicted to have at least one transmembrane domain (Supplemental Table S3).
Six additional potentially coding transcripts were significantly larger than the included ORF and could be bifunctional, acting both as an sRNA and an mRNA, and hence were included in the list. Five of these were longer than 320 nt, including CsrB2 (524/414 nt), which overlaps with a conserved ORF (Supplemental Table S1; see below).
Four copies of CsrB sRNAs in V. splendidus
V. cholerae has three paralogs of CsrB, two on chromosome I and one on chromosome II (Lenz et al. 2005). These genes are also present in V. splendidus (named here csrB1 to B3). In addition, a fourth copy, which we named csrB4, was detected on chromosome I (Fig. 6A).
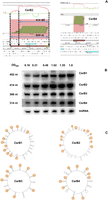
A fourth copy of CsrB in V. splendidus. (A) Visualization of the genomic context of CsrB2 (left) and CsrB4 (right) on the Artemis viewer. A graph representing the ln of the coverage is visible on the top window. Bam reads are visible below. (Salmon) The extent of both CsrBs. (Blue arrows) The two possible sizes of CsrB2. (Yellow boxes) Putative transcription terminator as predicted by ARNold. (B) Expression of the four CsrBs during growth of V. splendidus. The Northern blots were carried out as described in Figure 4. (C) Secondary structure of the four CsrBs as predicted by Mfold (see Materials and Methods for details). (Orange) The loops containing the CsrA binding motifs (AGGA or AGGGA).
We examined the expression pattern of all csrB genes by Northern blots of samples prepared at different time points along the growth curve (Fig. 6B). As previously shown for CsrB-like RNAs in Vibrios (Lenz et al. 2005), all four CsrBs were strongly expressed at high cell density. Their approximate size determined by Northern blot was in accordance with the size of the transcript observed from the RNA-seq, except in the case of CsrB2, for which the cluster was 524 nt long (Supplemental Table S1), whereas the size according to Northern blot was ∼410 nt (Fig. 6B). The difference of expression between the 5′ and the 3′ ends of the cluster (Fig. 6A) suggests that this RNA-seq read cluster might, in fact, correspond to the artifactual fusion of two transcripts. As already mentioned, CsrB2 overlaps with an ORF conserved in several other Vibrios.
All four CsrBs displayed the characteristic CsrB sRNA two-dimensional (2D) folding structure, with many of the CsrA-binding motifs, AGGA (Dubey et al. 2005), exposed in the loops of the stem–loop structures (Fig. 6C).
Antisense regulation
RNA-seq is the technique of choice to detect asRNAs that are currently not predictable computationally. However, many antisense transcripts may correspond to transcriptional noise or leaky transcription termination. Indeed, visually inspecting the data revealed many examples of long 3′ UTRs in antisense of the 3′ end of the downstream gene (data not shown). To increase our chance to detect true antisense sRNAs, we imposed on the candidates a minimal threshold coverage of 10, with a minimum of 10 reads in the cluster.
After thus filtering out low-expression antisense clusters, we retained 73 transcripts antisense to annotated CDSs (Supplemental Table S1_AS). The least expressed one was at 43 RPKM, with an average expression for these 73 asRNAs of 104 RPKM. This is compared with the average antisense expression over the genome, which was 3.19 RPKM (3.7 for chromosome I and 2.59 for chromosome II), the median being around 1. Hence, these 73 asRNAs represent a very conservative estimate of potential candidates. In Figure 7, we show an example of what looks like a good candidate for a regulatory asRNA. It is overlapping with the long 5′ UTR of the opposing gene, encoding the GMP reductase GuaC and is significantly expressed relative to guaC expression: With a RPKM value of ≈500, it was among the most expressed asRNAs, and its expression was more than four times this of guaC (Supplemental Table S4). It is also predicted to have a Rho-independent terminator (Fig. 7A), and we confirmed its expression and size by Northern blot (Fig. 7B).
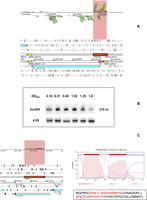
Two examples of putative asRNAs in V. splendidus. (A) Visualization of the genomic context of Vsr285 on the Artemis viewer. Bam reads are visible on the top window and are highlighted in salmon. (Orange box) The Vsr285 encoding gene. (Yellow boxes) Putative transcription terminators, predicted by ARNold. (Bright pink) The r5′UTR of VS_II1110 encoding GuaC. (B) Analysis of expression of Vsr285 during growth of V. splendidus. Northern blotting was carried out as in Figure 4. (C) Vsr65 could be part of a type I toxin–antitoxin system. (Left) Genomic context of Vsr65 (orange box), transcribed antisense of VS_0930 (blue box). (Right) TMHMM profile of VS_0930 (see Materials and Methods) and amino acid sequence of the peptide. (Red) The two predicted transmembrane domains.
By comparing our list of asRNA candidates, using BLASTN (Materials and Methods), with the list of small RNAs identified in four different studies in V. cholerae (Liu et al. 2009; Bradley et al. 2011; Mandlik et al. 2011; Raabe et al. 2011), we found that Vsr285 was conserved in V. cholerae: Liu et al. (2009) detected expression of its homolog, transcribed opposite of VCA0197, also encoding GuaC.
Only one another asRNA was found to be also present in V. cholerae: Vsr141 is transcribed opposite of VS_2048, coding for an alanine dehydrogenase; Liu et al. (2009) and Raabe et al. (2011) both detected an asRNA to VC1905, its ortholog in V. cholerae.
One specific category of asRNAs represses the expression of small hydrophobic toxic proteins that belong to the type I toxin–antitoxin (TA) systems (Fozo et al. 2008). Vsr65 and the opposite gene VS_0930 are good candidates to form such a type I TA system. Although the VS_0930-encoded peptide does not have similarity to known toxins, its small size (70 amino acids) and high hydrophobicity (it has two predicted transmembrane domains) give it the expected properties of such toxins. We detected the expression of Vsr65 by RNA-seq but not of VS_0930, suggesting that expression of the putative toxin is, indeed, repressed by the asRNA Vsr65 (Fig. 7C; Supplemental Table S4).
Gene expression of V. splendidus growing in rich medium
The average RNA-seq coverage for a genetic element gives some indication of its expression level. Although samples from various growth phases were pooled, the expression level, normalized as RPKM (Materials and Methods), represents a trend for cells growing exponentially in rich medium (Supplemental Table S4). As expected, genes coding for ribosomal proteins and tRNAs were highly expressed. But, surprisingly, the csrB genes were the most expressed, above ribosomal protein genes. csrB3 was also the most highly expressed gene of chromosome II. Another highly expressed sRNA gene was gcvB. In E. coli and Salmonella, GcvB was shown to regulate OppA and DppA negatively, the periplasmic component of the oligopeptide, and dipeptide transporters, respectively (Urbanowski et al. 2000), as well as the threonine/serine transporter SstT (Pulvermacher et al. 2009).
Overall, 19 trans sRNAs or ncRNAs (including RNase P, SRP 4.5S RNA, 6S and tmRNA, Spot42, and eight new putative trans sRNAs discovered in this study) were among the top 200 highly expressed genes of the genome. Only two of these highly expressed sRNAs were encoded on chromosome II.
Among highly expressed protein-coding genes, other than those coding for ribosomal proteins, were cspA and cspE, encoding cold-shock proteins involved in transcription antitermination (Bae et al. 2000), perhaps because V. splendidus was grown at 20°C and/or underscoring the adaptation of this species to relatively low temperatures.
Phyletic distribution of small RNAs in gamma-proteobacteria
As the number of identified sRNAs in the bacterial kingdom increases, questions concerning their origin can be raised. Out of 254 trans sRNAs (including Qrrs, which were not detected in the RNA-seq experiment, but not P26), 26 were previously known (not counting CsrB4), either because they matched Rfam 10.1 entries (18 sRNAs) and/or because they had been previously detected in V. cholerae (Supplemental Table S1; Liu et al. 2009; Bradley et al. 2011; Mandlik et al. 2011; Raabe et al. 2011).
Gene phyletic distribution pattern can bring important information regarding the way certain gene categories evolve within bacterial lineages. To determine the absence/presence pattern of our predicted sRNAs and r5′UTRs, we examined by BLASTN how many were conserved in the gamma-proteobacteria species (Materials and Methods). A similar search was not performed with the asRNAs since their conservation cannot be distinguished from that of the sense ORF. To evaluate the significance of our conservation data, we performed a similar search on a set of randomly drawn sequences from IGRs, with a similar size distribution and similar positioning related to neighboring genes as the candidates (see Materials and Methods). Results of this comparison are represented by boxplots (Supplemental Fig. S3), which show that candidate RNAs are significantly more conserved than the random IGR sequences, both in the case of sRNAs (Supplemental Fig. S3A) and of r5′UTRS (Supplemental Fig. S3B).
Supplemental Table S5 presents the phyletic distribution of the sRNA (Supplemental Table S5A) and r5′UTR candidates (Supplemental Table S5B) in the 137 gamma-proteobacteria species considered.
One hundred fifty-nine putative trans-encoded sRNAs in V. splendidus (62%) were found to be species-specific. Eighty-eight were coded on chromosome I and 71 on chromosome II. Out of five such sRNAs picked up at random from chromosome I, only two had two conserved flanking genes, and for five on chromosome II, only one had conserved flanking genes, suggesting that these species-specific sRNAs are preferentially located in regions of genomic rearrangements.
Supplemental Table S5A presents the phyletic distribution of the remaining 93 trans sRNAs (two sRNAs did not give a result in BLASTN because of low complexity) (Supplemental Table S1). In these, 53 correspond to sRNAs with “patchy” conservation patterns, possibly reflecting horizontal gene transfer events. For 41 of these, the majority of homologs were clustered in the alteromonadales, especially in Shewanella species, suggesting the possibility of extensive horizontal transfer between V. splendidus and shewanellaceae. Out of the 40 remaining, 34 appeared as monophyletic (present in a common ancestor and all its descendants), whereas six were paraphyletic (present in a common ancestor and some of its descendants), suggesting one or more gene loss events.
Highly conserved ncRNAs (beyond the vibrionales order) include those with housekeeping function (RNase P RNA, 4.5S RNA, and tmRNA), and trans sRNAs, Spot42, and RyhB (Supplemental Table S5A). Conservation of 6S RNA (initially characterized in E. coli) (Wassarman and Storz 2000) was only poorly detected, suggesting a rapid divergence of this RNA at the nucleotide level, whereas its secondary structure is highly conserved (Trotochaud and Wassarman 2005).
We identified a core set of 28 sRNAs (Qrr and CsrB counted only once, and not including P26) that were present in all Vibrios. Only seven of these (including Qrr and one copy of CsrB) were encoded on chromosome II. These putative Vibrio core sRNAs include the previously characterized MicX (Davis and Waldor 2007), VrrA (Song et al. 2008, 2010; Song and Wai 2009), and Tfor (Yamamoto et al. 2011). Thirty-seven to 38 sRNAs are in common between V. splendidus and V. cholerae, depending on the strain (Supplemental Tables S1, S5A). Out of those, 11 conserved novel sRNAs had not been detected in the previous transcriptomic studies carried out in the latter species (Liu et al. 2009; Bradley et al. 2011; Mandlik et al. 2011; Raabe et al. 2011). Two of these (Vsr262 and Vsr300) were confirmed by Northern blotting (Fig. 4) and seven by RT-PCR (Fig. 5; Supplemental Table S1).
Putative cis-regulatory elements appeared to be slightly more conserved than trans-encoded sRNAs, with 58% being species-specific. The fact that r5′UTRs appeared significantly more conserved than random sequences with the same size distribution, and at similar distances from start codons (Supplemental Fig. S3B), indicates that this higher conservation does not simply reflect conservation of gene regulatory regions. The phyletic distribution of the 198 non-species-specific r5′UTR candidates is presented in Supplemental Table S5B. Eighty-six were present in all species of the Vibrio genus (18% compared with 12% for sRNAs). In the “noncore” putative r5′UTRs, 27 had putative homologs outside the vibrionales and displayed the “patchy” conservation pattern suggestive of horizontal transfer (Supplemental Table S5B). Among the 20 most conserved r5′UTRs were mostly riboswitches such as FMN, cobalamin, TPP, lysine, GEMM, or MOCO. With one exception, they were all encoded on chromosome I. Surprisingly, given that the tfox gene and the sRNA Tfor are both conserved in V. splendidus (Vsr152) (Supplemental Table S1) and that in V. cholerae Tfor targets the 5′ UTR of the tfox message (Yamamoto et al. 2011), the 5′ UTR of the tfox message in V. splendidus appears to be specific to this species.
DISCUSSION
Compared with what is known about regulatory sRNAs in enterobacteriaceae, especially in E. coli and Salmonella, information is still scarce in the Vibrio genus, beyond the important human pathogen V. cholerae, in which most of the genome-wide studies published so far were carried out. We report here the first genome-wide transcriptomic study and extensive sRNA search in a Vibrio other than V. cholerae.
Genome expression dynamics in a two-chromosome species
All vibrionales are characterized by the presence of two circular chromosomes. Most of the well-conserved core genome genes with housekeeping functions are located on chromosome I, whereas chromosome II is the main source of genomic plasticity and comprises most of the accessory genes, especially those involved in adaptation to specific conditions. We observed that, on average, genes from chromosome I were about 3.6 times more expressed than those from chromosome II. Our results confirm at a genome-wide scale an observation made in several Vibrio species, including V. parahaemolyticus (Dryselius et al. 2008). In V. cholerae, Xu et al. (2003) compared gene expression in mid-exponential phase in vitro and in small-intestine-growing cells. Under both conditions, genes showing the highest levels of expression resided primarily on the large chromosome, but many more genes from the small chromosome were specifically expressed in the intestine. Hence, one factor explaining the differential expression between the two chromosomes is the favored presence on chromosome II of genes expressed only in specific conditions. Another contributing factor may be gene dosage through differential copy number between the two chromosomes (Dryselius et al. 2008; Stokke et al. 2010). Indeed, because the onset of replication is delayed in chromosome II compared with chromosome I, oriI has a copy number up to twice that of oriII, the effect being amplified at high growth rates (i.e., rich medium at 37°C) (Stokke et al. 2010).
Our results also strikingly illustrate a tendency to have more genes highly expressed closer to the origin of replication than to the terminus, as was noted before in E. coli by Rocha (2004), although in our case, this is especially true in the case of chromosome I. Again, higher expression around the replication origin is favored by a gene dosage effect since the region of oriC is in higher copy number than the region of terC (Stokke et al. 2010). Furthermore, as previously reported for E. coli (Blattner et al. 1997), we observed that V. splendidus highly expressed genes, typically ribosomal operons, show codirectional alignment of transcription units with the direction of replication (Fig. 1) to avoid head-on collision between the replication complex and the RNA polymerase (Rocha 2004).
Curiously, such trends do not seem to exist in chromosome II, where some of the most highly expressed genes were even found in the vicinity of terII.
In conclusion, chromosome II displays a gene-dosage-independent low-expression pattern, underscoring an evolutionary tendency for low-expression genes and/or genes expressed only in specific conditions to cluster on this chromosome, and a lesser constraint of replication dynamics upon gene positioning.
Novel sRNAs
We have identified 73 asRNA, 250 trans-encoded sRNA, and 471 r5′UTR candidates. The number of potential r5′UTRs suggests that at least 9% of protein-encoding genes are the target of complex post-transcriptional regulation. These cis-regulatory elements could constitute novel riboswitches and/or recruit anti or transcription termination factors, or be the targets of trans-acting sRNAs (either trans-encoded or cis-asRNAs). For example, VS_II1110, encoding the GMP reductase GuaC, has a long 5′ UTR that can be targeted by the asRNA Vsr285 (Fig. 7).
In V. splendidus, we identified CsrB4, an additional copy to the three CsrBs reported in other Vibrios such as V. cholerae and V. harveyi (Lenz et al. 2005). CsrB4 is maximally expressed at high cell density, as shown for other CsrBs. The physiological role of this extra copy in V. splendidus is currently under investigation.
Somewhat surprisingly, since sRNAs are important for adaptation to specific conditions and generally expressed only in such conditions, 15 regulatory sRNAs, including CsrB (all four copies of it), GcvB, and Spot42, were found to be among the 200 most highly expressed genes in exponentially growing V. splendidus, together with ribosomal protein genes and two genes encoding cold shock proteins (Supplemental Table S4). High expression of CsrB RNAs is in keeping with the hardly detectable expression of the four copies of Qrr, since CsrB RNAs indirectly and negatively regulate qrr1-4 (Lenz et al. 2005). We did not determine whether this lack of Qrr expression is the result of our specific growth conditions or is species-specific in such conditions.
The existence of Rho-independent terminators is a criterion often integrated in sRNA detection programs. However, more than two-thirds of the putative sRNAs did not have such a terminator at their 3′ end (Supplemental Table S1). Moreover, we were able to confirm by Northern blot the existence of two sRNAs with no terminator (Vsr300 and Vsr320) (Fig. 4).
RNA-seq as a tool for genome reannotation
Comparing intergenic RNA-seq transcripts with CDS predicted by GeneMarkHMM and Glimmer, and further examining their conservation, led us to predict five new, non-annotated but conserved ORFs of size 28–61 amino acids (Supplemental Table S3). Four of these conserved ORFs are predicted to be inner membrane proteins. Small hydrophobic ORFs are often missed by annotation programs, and their putative importance as regulatory peptides has been recognized only recently. For instance, in Salmonella the 30-amino-acid MgtR protein negatively regulates the MgtC virulence factor by promoting its degradation (Alix and Blanc-Potard 2008). Many of these peptides are hydrophobic and can span the inner membrane (Alix and Blanc-Potard 2009). Our four ORFs are potential candidates to be such regulatory peptides.
Finally, our analysis of long 5′ UTRs for coding capability led us to correct several misannotated start codons (Supplemental Table S3).
Bifunctional sRNAs
An additional category of coding sRNAs comprises sRNAs that act both as regulatory and as coding RNAs. One classical example is SgrS, which, as an sRNA, targets the glucose transporter gene ptsG mRNA but also encodes the small peptide SgrT, which inhibits glucose uptake (Wadler and Vanderpool 2007). We found six potential bifunctional sRNAs characterized by a short ORF and a size significantly larger than the ORF size (Supplemental Table S1). Although five of them were larger than 320 nt, one of these sRNAs, Vsr262, confirmed by Northern blotting (Fig. 4), is 167 nt long. It is conserved in Vibrios at the nucleotide-sequence level (Supplemental Table S5) but has not been reported previously in V. cholerae, and encodes in V. splendidus a small ORF of 24 amino acids, which is homologous to similar small ORFs present in a subset of other Vibrios. Further studies are required to confirm its expression as well as its potential function in relation to the sRNA role.
Antisense transcription
Development of high-throughput methods, such as high-resolution tiling arrays and RNA deep sequencing, has led to the discovery of pervasive antisense transcription both in eukaryotes and in prokaryotes (Selinger et al. 2000; Sharma et al. 2010; Lasa et al. 2011; Mraheil et al. 2011). The reported percentage of genes within a genome potentially subject to asRNA regulation varies from 3% to >50% according to studies (Lasa et al. 2011). In Helicobacter pylori, Sharma et al. (2010) found that at least 46% of coding genes had an associated antisense transcription start site (TSS), using a 5′-P-dependent exonuclease treatment to determine TSSs. Although 51.4% of CDSs in our study had at least one antisense read that can indicate the existence of a TSS, the ratio goes down to 1.6% when we applied our more stringent criteria for antisense expression.
A significant fraction of antisense transcription appeared to result from inefficient transcription termination, leading, for instance, to a long 3′ UTR overlapping with the mRNA of the downstream gene/operon (data not shown).
Selecting the antisense transcripts that were the most significantly expressed, we identified 73 candidates that may represent specific regulatory asRNAs, including Vsr285, which potentially regulates the expression of the GMP reductase gene guaC. Vsr285 expression was confirmed by Northern blots and was found to decrease in stationary phase (Fig. 7). A similar antisense for guaC was previously detected in V. cholerae in one sRNA-seq study (Liu et al. 2009) but was not otherwise validated.
However, the minimal expression threshold we used to extract antisense candidates was well above the average level of genome-wide antisense transcription, and our list of 73 asRNA candidates is likely an underestimation. Determining appropriate criteria to discriminate functional asRNAs from a high background of antisense transcription remains a challenge for the analysis of RNA-seq data.
Conservation of sRNAs
Many sRNA prediction software programs rely on sequence conservation. However, we found that >62% of V. splendidus sRNAs were species/strain-specific. Likewise, a conservation analysis of all experimentally determined V. cholerae sRNAs showed that up to 50% of sRNAs were strain-dependent, i.e., not conserved in all V. cholerae strains (data not shown). Twenty-one percent of sRNAs showed a pattern of conservation consistent with horizontal transfers, especially between vibrioanaceae and shewanellaceae (Supplemental Table S5A). Among the rest, we identified 28 trans sRNAs as candidates to form an “sRNA core” of the Vibrio genus (counting CsrB and Qrr only once). This small number is probably an underestimation and may reflect the well-known lack of conservation of sRNAs at least at the primary sequence level. For instance, conservation of CsrB and GcvB was not detected by BLAST beyond the vibrionaceae, whereas they are present in enterobacteriaceae. Using a method relying on 2D structure conservation using covariance models in addition to primary sequence conservation may help to improve our definition of the Vibrio core sRNome.
The rapid divergence of sRNAs may be explained by two factors: (1) Overall conservation constraints linked to functionality are weak, because they result from short, imperfect pairing between sRNAs and their target(s) (Papenfort et al. 2010); and, (2) additionally, sRNAs may have to evolve rapidly within a species due to coevolution of the sRNA and its target.
In addition, the high number of species and even strain-specific sRNAs suggest that most have evolved recently, after species divergence, possibly by cooptation (or “exaptation”) (Gould and Vrba 1982) of a small transcript resulting from transcriptional noise, which happens to target a mRNA for a specific function. Altogether, our results suggest strongly that sRNAs evolve mostly vertically within a phylum, and the presence/absence of an sRNA is often best explained by secondary gene loss, especially in the case of sRNAs specific to vibrionales (Supplemental Table S5A). This pattern of evolution is similar to what is described in the recent study by Skippington and Ragan (2012), concerning sRNAs in E. coli. In addition, sRNA duplications seems to have played an important role in the phyletic distribution of sRNAs in the vibrionaceae, the variable number of CsrBs and Qrrs being good examples. We also observed that several sRNAs were in multicopy in V. splendidus and in variable number in other Vibrios (data not shown). These have not yet been investigated further.
Finally, cis-regulatory elements appear to be overall more conserved than sRNAs, whereas asRNAs seem either very little conserved, or difficult to detect, if one considers that, by comparing our RNA-seq results to other experimental studies having described asRNAs in V. cholerae (Liu et al. 2009; Bradley et al. 2011; Mandlik et al. 2011; Raabe et al. 2011), we could identify only two asRNA candidates (Vsr141 and Vsr285) in V. splendidus that were previously described in V. cholerae (Liu et al. 2009; Raabe et al. 2011).
In conclusion, this high-throughput RNA-seq experiment opens up a unique vista on the landscape of genome expression in a two-chromosome species such as V. splendidus. It not only led to the discovery of hundreds of potential new regulatory RNAs, be it r5′UTR, sRNAs, or asRNAs, but also sheds light on the evolutionary dynamics of regulatory RNAs in the vibrionale family, being the first study addressing this question at the interspecies level.
MATERIALS AND METHODS
Bacterial growth conditions and RNA preparation
V. splendidus LGP32 (Le Roux et al. 2009) was grown at 20°C under agitation in marine salt medium (4 g/L peptone, 1 g/L yeast extract, 0.1 g/L ferric phosphate, 30 g/L sea salt).
An overnight culture of V. splendidus was diluted at 1:100 in 100 mL of marine salt medium, and cells were grown until entry into stationary phase. Growth was monitored by measuring the OD at 600 nm (OD600). The first sample was taken at time 3 h (early exponential phase, OD600 = 0.16), and then each hour until entry into stationary phase (8 h, OD600 = 1.8) (Supplemental Fig. S1). For each sampling, 7 mL of 100% ethanol at −20°C was immediately added to 7 mL of bacterial cultures to prevent further RNA degradation. After centrifugation at 4°C, cell pellets were kept at −80°C until RNA preparation. Total RNA was obtained by hot acidic phenol extraction, followed by chloroform extraction and ethanol precipitation. RNA quality was monitored by agarose gel electrophoresis and a 2100 Bioanalyzer (Agilent Technologies Inc.). Concentration was measured using the NanoDrop 1000 Spectrophotometer (Thermo Fisher Scientific Inc.). Equivalent amounts of each six samples (1 μg) were pooled and treated to enrich in primary transcripts (mRNAs and sRNAs) using a 5′-phosphate-dependent exonuclease (Terminator, Epicentre), following the manufacturer's instruction except that incubation was done for 1 h 30 min at 30°C.
High-throughput cDNA sequencing and data analysis
Strand-specific RNA-seq template library was prepared starting from a pool of total mRNA-enriched samples (50 ng) following the directional mRNA-seq library preparation protocol provided by Illumina Inc. This protocol relies on the utilization of a combination of the “Small RNA sample prep kit” and the “mRNA-seq library prep kit”: RNAs were chemically fragmented using the provided fragmentation buffer, purified, and treated with phosphatase and kinase. T4 RNA Ligase 2, truncated (New England Biolabs), was used to ligate the v1.5 sRNA 3′ adapter to the 3′ end of the RNA fragments. This enzyme is highly specific for RNA. The SRA 5′ adaptor was subsequently ligated using T4 RNA ligase, allowing for subsequent orientation of the sequencing reads. The ligated RNA fragments were then reverse-transcribed prior to PCR amplification. The library was sequenced (38-bp single-read sequencing) using an Illumina Genome Analyzer IIx. These steps were performed at the CNRS Imagif platform (Gif sur Yvette, France).
Transcript assembly and classification
Reads having passed the quality filter, after trimming of the sequencing adapters, were aligned to chromosomes I and II of V. splendidus LGP32 (NC_011753.2 and NC_011744.2) using Bowtie (Langmead 2010) with a tolerance of a maximum of two mismatches per read. The resulting data (reads mapped at unique positions on the reference genome) were converted by SAMtools (Li et al. 2009) into BAM format, which is read by BamView (Carver et al. 2010), an interactive Java application for visualizing the sequence reads. BamView has also been integrated into Artemis (Rutherford et al. 2000) so that the reads can be visualized in the context of the nucleotide sequence and genomic feature annotations.
RNA-seq read alignments were analyzed using a mix of S-Mart Python tools (S-MART-1-1.0.9 version) (Zytnicki and Quesneville 2011) and self-made Perl scripts. Three different workflows were designed and run, one for each category of transcripts of interest, r5′UTRs, intergenic trans sRNAs, and asRNAs. Roughly, each workflow involved successive steps: (1) read clustering, (2) cluster selection, (3) candidate filtering, (4) manual validation. All candidate loci were compared with the results of a Rfam scan (release 10.1) (Gardner et al. 2011) of the V. splendidus genome. They were nonredundantly added to the misc_rna feature list of the genome annotations to constitute the already “known” regulatory RNA set. This training set was used to adapt the workflow parameters.
-
To define transcripts, overlapping reads were clustered. This procedure may result in split transcripts in case of genes with sparse RNA-seq coverage. To minimize the extent of transcript splits, clusters that were separated by <20 nt were merged (d = 20 in Fig. 2). This distance as well as the other parameters detailed below were optimized using both the training set and manual curation of the results. Note that this risk of transcript split into several read clusters is minimized in the case of short transcripts such as those corresponding to small RNAs. In addition, we compared the results for d = 0, 10, 20, and 30 nt (Supplemental Fig. S4). As expected, in case of the trans sRNAs and the antisense asRNAs, increasing d resulted in fewer candidate transcripts, since in some cases two clusters could be merged together. On the contrary, in the case of r5′RNAs, increasing d led to an increase of the number of candidates, because it could generate longer clusters that could pass the 50-nt length threshold and then qualify as r5′UTRs (Supplemental Fig. S4). We also compared the results in terms of correct prediction of regulatory RNAs present in Rfam. d = 0 resulted in missing a majority of Rfam-predicted r5′UTRs, whereas d = 30 resulted in missing one trans sRNA. Both d = 10 and d = 20 gave the same, optimal result, in this regard.
-
The selection step compared transcription clusters with annotation features. For each considered category, specific criteria were applied to select read clusters belonging to the category.
-
sRNAs were defined as read clusters expressed from IGRs (i.e., regions with no annotated features) and separated by a minimum of 30 nt from the upstream and downstream genes if they were in the same orientation as the cluster or 10 nt if they were in the opposite orientation.
-
r5′UTRs were defined as clusters located in IGRs and overlapping with the −25 −15 region upstream of the start codon of the downstream CDS. Such clusters could also correspond to the noncoding regions within operons. We first tried to use the prokaryotic operon database DOOR (Mao et al. 2009) to predict transcription units and filter out these clusters. However, manual inspection of the resulting potential cis-elements indicated that as many as 50% of the candidates corresponded most likely to such regions, whereas looking for 5′-UTR regulatory elements in IGRs >150 nt led to <10% of the candidates corresponding to potential operon transcripts. These were removed from the final list.
-
asRNAs were defined as clusters mapping outside IGRs >150 nt, but were allowed to overlap a region of 20 nt upstream of a CDS start codon, since an asRNA could target, at least partially, a 5′-UTR region.
-
-
3. Quantitative filters were added to select the best candidates, based on length (≥50 nt), the number of reads in the cluster (≥10 nt), and the read coverage of the candidate. In the case of sRNAs, we considered only clusters with a minimum coverage [defined as the (number of reads) × 38 nt/(length of the element)] of 5. In the case of r5′UTRs, because of the possibility of low-expression cis-regulatory elements (if they were in front of poorly expressed genes, for instance), we did not apply a minimal coverage filter. In the case of asRNAs, because the extent of antisense transcription suggested that many antisense transcripts could be due to transcriptional noise, we further applied a filter for clusters with a minimal coverage ≥10, corresponding approximately to an RPKM ≥40 (depending on the size of the cluster).
-
4. We then inspected each candidate visually in the context of annotations and Rho-independent terminators predicted by ARNold (Naville et al. 2011) (http://rna.igmors.u-psud.fr/toolbox/arnold/), using the Artemis genome viewer. Upon inspection, some potential regulatory RNAs were discarded or changed category. A few bioinformatically undetected sRNA candidates were also added to the list. Using the final version of the scripts, most candidates were validated (see the Results section for details and examples).
Finally, sRNAs and r5′UTRs were examined for the presence of potential ORFs using Glimmer v 3.02 (Delcher et al. 1999) and GeneMarkHMM v 2.8 (Lukashin and Borodovsky 1998). The Glimmer default size for ORF prediction is 90 bp, whereas GeneMarkHMM does not have a minimal default size and predicted ORFs as small as 84 bp (Supplemental Table S3).
Other computational methods
For each genetic element or feature, in addition to the coverage, we normalized gene expression levels using the “reads per kilobase of feature per million mapped reads,” or RPKM, defined as (total feature reads)/(total mapped reads [in millions] × feature length [in kilobases]). We performed sRNA folding predictions using Mfold v2.3, with a folding temperature of 20°C (http://mfold.rna.albany.edu/?q=mfold/). We carried out transmembrane domain prediction in sRNA-encoded peptides using TMHMM v2.0 (http://www.cbs.dtu.dk/services/TMHMM/).
Northern blots
Oligonucleotide probes were labeled at their 5′ ends using polynucleotide kinase (Fermentas) and [γ-32P]ATP. The sequence of the oligonucleotides used in this study is provided in Supplemental Table S2.
Total RNAs extracted from different time points along the growth curve were isolated as described above, and Northern blots were performed as described (Marchais et al. 2009; Bohn et al. 2010). RNA size markers (Fermentas) were run alongside the samples to allow estimation of transcript sizes. Equal loading was controlled using probes against tmRNA or 4.5S RNA (Supplemental Table S2).
RT-PCRs
Total RNA samples were prepared as described above from three time points of growth: early log-phase, mid log-phase, and beginning of stationary phase, corresponding to OD600 ≈ 0.18, 0.62, and 2.1, respectively. Ten micrograms of total RNA was treated by DNaseI to remove contaminating genomic DNA, using the DNA-free kit (Ambion). Two micrograms of DNA-free RNA was reversed-transcribed using the ThermoScript RT-PCR System kit (Invitrogen) following the manufacturer's instructions. Two microliters of the resulting cDNA (200 ng) was then used for PCR amplification using a couple of primers (Supplemental Table S2) specific to the transcript to be detected.
Conservation of sRNAs in bacteria
To focus on a genus conservation view of sRNAs, expression data from four high-throughput studies previously reported in V. cholerae were collected. Liu et al. (2009) applied the 454 pyrosequencing technology to identify the sRNA transcriptome of V. cholerae and listed 2140 transcripts. When taking into account overlapping transcripts, this results in 1412 transcripts corresponding to CDSs, 109 to antisense, and 290 to intergenic sRNAs (our own results). Mandlik et al. (2011) carried out an RNA-seq-based transcriptome analysis of V. cholerae in two animal infection models yielding a list of 119 differentially expressed sRNAs. Bradley et al. (2011) conducted a genome-wide survey in V. cholerae by sRNA-seq to identify ToxT-regulated sRNAs, identifying 17 new sRNAs. Raabe et al. (2011) analyzed 7500 cDNAs of V. cholerae by conventional cloning and sequencing, thus detecting 243 ncRNAs, including 98 asRNAs and 149 intergenic sRNAs.
All overlapping transcripts from the four studies were clustered to remove redundancy, leading to the identification of 676 regulatory small RNAs in V. cholerae. Nucleotide similarities between regulatory RNAs (r5′UTRs, sRNAs, and asRNAs) from both V. splendidus and V. cholerae were determined using BLASTN (2.2.15 version) with parameters -W 7 -r 2 -q -3 -G 5 -E 2 -e 10.
The conservation of V. splendidus sRNAs and r5′UTRs was explored using BLASTN, to search for homologs in a database of 1069 prokaryotic complete genomes described in Marchais et al. (2009) and Ott et al. (2012). BLASTN parameters were the same as above except for an empirical bit score cutoff of 42. Only the best hit for each species was kept. Manual inspection of some results showed a high false-positive rate in case of species beyond the gamma-proteobacteria embranchment. Hence, only the results within this embranchment were analyzed and presented in this study. Our database comprised 249 gamma-proteobacteria genomes, representing 134 different species.
To order the genomes shown in Supplemental Table S5, we retrieved 16S rRNA sequences for a subset of species/strains (54 sequences) at http://www.arb-silva.de/ representing each family, and each strain of vibrionales present in the database. These sequences were then used to construct a tree at http://www.phylogeny.fr/ (Dereeper et al. 2008), using ClustalW for the initial alignment.
In addition, we randomly extracted sequences with both the same size distribution and a similar distance to annotated genes (CDS, tRNA, rRNA, misc_RNAs, candidates sRNAs, and r5′UTRs from this study) as the tested candidates and applied the same protocol to these sequences. We then evaluate the statistical significance of the observed difference between the two sets of results by a Student's test.
SUPPLEMENTAL MATERIAL
Supplemental material is available for this article.
ACKNOWLEDGMENTS
We are grateful to Frédérique Le Roux (Ifremer, Station Biologique de Roscoff, France) for the gift of the V. splendidus LGP32 strain; to Erwin Van Dick and Claude Thermes (Imagif Platform, Gif Sur Yvette, France) for expert assistance with the RNA-seq experiment; to Chantal Bohn for expert technical assistance; to Karine Budin (Institut de Génétique et Microbiologie) for help with the Bioanalyzer analyses of RNA preparations; to Matthias Zytnicki (INRA, Versailles, France) for advice and help with the use of the S-MART software; and to Caol Ila for discussion, ideas, and warm support. We thank the anonymous referees for useful comments and suggestions. This work was supported by the Agence Nationale de la Recherche (ANR): Program “Blanc” [Blanc-ANR-2010-BLAN-1602-01 “Duplex-Omics”] to D.G. and P.B.; Program “Blanc-Biodiversité, écologie et agronomie” [ANR 11 BSV7 023 02 ‘Vibriogen’] to A.J.
Footnotes
-
↵2 Corresponding author
E-mail annick.jacq{at}u-psud.fr
-
Article published online ahead of print. Article and publication date are at http://www.rnajournal.org/cgi/doi/10.1261/rna.033324.112.
- Received March 21, 2012.
- Accepted September 8, 2012.




