


Sharing and archiving nucleic acid structure mapping data
- Philippe Rocca-Serra1,
- Stanislav Bellaousov2,
- Amanda Birmingham3,
- Chunxia Chen4,
- Pablo Cordero5,
- Rhiju Das5,
- Lauren Davis-Neulander4,
- Caia D.S. Duncan6,
- Matthew Halvorsen4,
- Rob Knight7,8,
- Neocles B. Leontis9,
- David H. Mathews2,
- Justin Ritz4,
- Jesse Stombaugh7,
- Kevin M. Weeks6,
- Craig L. Zirbel10 and
- Alain Laederach4,11
- 1Oxford e-Research Center, University of Oxford, OX1 3QG, Oxford, United Kingdom
- 2Department of Biochemistry and Biophysics and Center for RNA Biology, University of Rochester, Rochester, New York 14642, USA
- 3Thermo Fisher Scientific, Lafayette, Colorado 80026, USA
- 4Biology Department, University of North Carolina, Chapel Hill, North Carolina 27599-3290, USA
- 5Biochemistry Department, Stanford University, Stanford, California 94305, USA
- 6Department of Chemistry, University of North Carolina, Chapel Hill, North Carolina 27599-3290, USA
- 7Department of Chemistry and Biochemistry, University of Colorado, Boulder, Colorado 80309, USA
- 8Howard Hughes Medical Institute, Boulder, Colorado 80309, USA
- 9Department of Chemistry, Bowling Green State University, Bowling Green, Ohio 43403, USA
- 10Department of Mathematics and Statistics, Bowling Green State University, Bowling Green, Ohio 43403, USA
Abstract
Nucleic acids are particularly amenable to structural characterization using chemical and enzymatic probes. Each individual structure mapping experiment reveals specific information about the structure and/or dynamics of the nucleic acid. Currently, there is no simple approach for making these data publically available in a standardized format. We therefore developed a standard for reporting the results of single nucleotide resolution nucleic acid structure mapping experiments, or SNRNASMs. We propose a schema for sharing nucleic acid chemical probing data that uses generic public servers for storing, retrieving, and searching the data. We have also developed a consistent nomenclature (ontology) within the Ontology of Biomedical Investigations (OBI), which provides unique identifiers (termed persistent URLs, or PURLs) for classifying the data. Links to standardized data sets shared using our proposed format along with a tutorial and links to templates can be found at http://snrnasm.bio.unc.edu.
Keywords
INTRODUCTION
Fields in which data standardization has allowed sharing among many researchers, including sequence data in GenBank (Benson et al. 2008; Wheeler et al. 2008) and structural data in the Protein Data Bank (Bernstein et al. 1977), have benefited enormously from the ability of investigators to draw insights from the work of thousands of people dispersed across the globe (Cannone et al. 2002; Griffiths-Jones et al. 2003; Noy et al. 2003; Zhang et al. 2006; Elnitski et al. 2007; Musen et al. 2008; Brown et al. 2009). At present, there is currently no standard database for archiving and sharing nucleic acid structure mapping data, despite the compelling opportunities to incorporate such data in studies with direct relevance to human health and to a wide range of scientific challenges (Russell and Herschlag 2001; Tullius 2002; Schroeder et al. 2004; Takamoto et al. 2004; Thirumalai and Hyeon 2005; Mortimer and Weeks 2007; Tijerina et al. 2007; Shcherbakova and Brenowitz 2008; Woodson 2008; Deigan et al. 2009). Chemical and enzymatic structure mapping techniques are useful in the field of nucleic acids and are commonly used to experimentally validate and/or constrain structural predictions, “footprint” protein-binding sites, and characterize folding reactions both kinetically and thermodynamically (Mathews et al. 2004; Deigan et al. 2009; Quarrier et al. 2010; Weeks 2010). Recent developments allowing the analysis of chemical mapping reactions in a quantitative and high-throughput manner yield large amounts of high-quality data that require automated processing and annotation (Das et al. 2005; Laederach et al. 2008; Mitra et al. 2008; Vasa et al. 2008; Wilkinson et al. 2008; Deigan et al. 2009; Watts et al. 2009; Underwood et al. 2010).
A standardized approach for making such data available upon publication is needed to facilitate sharing and wider dissemination of these results. Figure 1A illustrates the unfortunately common scenario in our laboratories when structure-mapping data are collected. A laboratory colleague carefully collects data and meticulously records this work in a laboratory notebook. The data are then analyzed and published in a thesis and a scientific journal as an detailed multicolored diagram. Upon graduation, the thesis and data are often misplaced (Fogarty 2002). As a result, the primary data are lost and any attempt to reanalyze the data in a new context requires manually extracting data from a manuscript figure or from a PDF file in a manuscript supplement. In this work, we seek to advocate for an alternative scenario that greatly diminishes the risk of data loss and provides the data in a computer readable format (Fig. 1B).
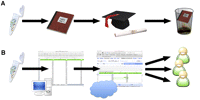
Different possible scenarios for SNRNASM (single nucleotide resolution nucleic acid structure mapping) data. (A) RNA chemical probing data is collected, recorded in a laboratory notebook, and published in a manuscript as an elaborate, colorful figure. This allows the graduate student who collected the data to graduate. Unfortunately, the raw data, meticulously recorded in the laboratory notebook, becomes lost (Fogarty 2002). (B) Proposed alternative in which the data is stored in a computer, uploaded to a publicly available server (in the cloud), and made downloadable upon publication of the manuscript, allowing other investigators access for new analyses.
We consider here the distinct types of structure mapping data and organize them into an ontology that reveals the relationships among various techniques. We then describe a system that both allows diverse users to integrate their nucleic acid probing data and facilitates the description of new techniques as they are developed. This systematization of knowledge and data will thus facilitate comparisons among methods, meta-analyses combining many independent lines of evidence about nucleic acid structure, and automated retrieval of nucleic acids for which good structural data are available.
APPROACH
Classification of SNRNASM assays
An important first step in sharing data efficiently is accurately defining the vocabulary used to describe an experiment. This is particularly important if one of the goals of sharing data is to facilitate meta-analyses using automated tools. Ontologies are commonly used to define terms and the relations between them in a precise way (Noy et al. 2003; Leontis et al. 2006; Brown et al. 2009). We therefore describe single nucleotide resolution nucleic acid structure mapping (SNRNASM) experiments in terms of an ontological framework. We note that the use of the idiosyncratic term SNRNASM is intentional. This term is unique to our approach for archiving nucleic acid probing data and will make it readily Internet searchable.
We have added terms to the Ontology of Biomedical Investigations (OBI) for 23 types of SNRNASM assays (Brinkman et al. 2010). We chose to include terms describing SNRNASMs into OBI, which focuses specifically on describing assays like structure mapping. We define two types of SNRNASMs, chemical and enzymatic mapping (Fig. 2). These two terms have corresponding OBI identifiers, OBI:0001017 and OBI:0001014, respectively (Fig. 2). The lines in Figure 2 represent “is a” relationships between terms. One can therefore infer from our ontological classification that, for example, RNase T1 structure mapping is an enzymatic-mapping assay, which is also a SNRNASM. Although this may seem obvious to those familiar with the field of RNA structure mapping, in the larger context of integrating multiple data sets for meta-analyses, it is essential to identify these elementary relationships explicitly. This strategy greatly facilitates the implementation of automated data meta-analyses algorithms (Leontis et al. 2006; Whetzel et al. 2006; Moreira and Musen 2007).

Graphical representation of the different terms we added to OBI (the Ontology of Biomedical Investigations) used to describe single nucleotide resolution nucleic acid structure mapping (SNRNASM) experiments. Each term is assigned a unique identifier (e.g., OBI:0001014) and organized by a series of hierarchical relationships. We used “is a” relationships in this case. For example DNAse I structure mapping (OBI:0001016) “is an” enzymatic mapping (OBI:0001014) experiment, which “is an” SNRNASM (OBI:0000807). In organizing our description of structure mapping experiments in this way, it becomes possible to design algorithms that will automatically identify relationships between different data sets.
Our ontological classification of SNRNASMs also captures the fact the chemical and enzymatic structure mapping experiments almost always use a specific probe, which is generally an enzyme or chemical compound. For this reason, we have defined the “input” of structure-mapping assays as the chemical or enzyme reagent used to probe the nucleic acid (Table 1, Specific Input column). Furthermore, we explicitly identify these chemicals and enzymes in their respective ontologies, Chemical Entities of Biological Interest (CHEBI) (Degtyarenko et al. 2008, 2009), and Protein Ontology (PRO) (Natale et al. 2007, 2011). Additionally, for each entry, we have provided alternative names (for example, NMIA structure mapping is commonly known as SHAPE), and corresponding primary references. The SNRNASM classification is thus integrated into the larger ontological framework being developed for genomic annotations (Natale et al. 2007, 2011; Degtyarenko et al. 2008, 2009).
SNRNASM assays currently in OBI along with their corresponding inputs (probes)
Accessing SNRNASM classifications
The field of nucleic acid structure mapping is continuously evolving as new chemical and enzymatic probes are developed (Wilkinson et al. 2006; Mortimer and Weeks 2007; Regulski and Breaker 2008; Shcherbakova and Brenowitz 2008). It is therefore important that any effort to classify these experimental techniques also evolve to reflect the field accurately. All SNRNASM terms to date have been submitted to OBI, and are therefore accessible in OWL and OBO format (Moreira and Musen 2007) from http://obi-ontology.org. Practically, the annotations are easily visualized and edited in an ontology editor such as Protégé (Noy et al. 2003; Supplemental Fig. 1). New annotations from the community can be readily added and will appear in new OBI releases. For example, some annotations (e.g., RNase I) are “in process” and will therefore be added to OBI after the publication of this manuscript (Fig. 2).
To facilitate access to our SNRNASM classification we have developed a series of spreadsheets that provide a straightforward framework for annotating a chemical or enzymatic mapping experiment. Links to these spreadsheets can be found at http://snrnasm.bio.unc.edu, which are hosted in the “cloud,” currently Google Docs servers. “Cloud” servers can be any publically available computer designed to store and disseminate data. By placing these documents in the cloud, no single lab is responsible for hosting these files on their servers, and anyone can edit an archived file if necessary. Our goal is to facilitate community involvement in the annotation process and to enable the groups developing new structure-mapping techniques to specify the terms that best describe their techniques.
Data sharing using the ISA-Tab format
The ontological framework we described above allows us to define structure-mapping experiments precisely. From a practical perspective, by associating an OBI term with each type of structure-mapping experiment (Fig. 2), it is possible to specify uniquely the type of experiment that was carried out on a nucleic acid. Although this represents a significant advantage in terms of being able to search for specific data sets, additional experimental information is required to be able to compare data sets effectively. For example, experimental conditions such as monovalent and divalent ion concentrations significantly affect RNA folding; it is essential to specify these conditions when undertaking comparative data analysis (Deras et al. 2000; Heilman-Miller et al. 2001a; Uchida et al. 2003; Das et al. 2008; Quarrier et al. 2010). Furthermore, SNRNASM data can be collected in different ways (using direct labeling of the RNA and gel electrophoresis, or reverse transcription followed by cDNA fragment analysis on a capillary sequencer (Mitra et al. 2008; Vasa et al. 2008). It is therefore important to capture, at minimum, the defining characteristics of experimental details in an annotation.
Defining best practices for experimental annotation of data is a nuanced challenge (Griffiths-Jones et al. 2005; Whetzel et al. 2006; Brown et al. 2009). On one hand, capturing as much detail as possible is ideal from a future analysis perspective. However, excessive annotation requirements are burdensome for the individual trying to share data, and can significantly decrease the overall amount of data shared. We therefore chose to require minimal annotations and developed a flexible format for sharing data that allows the user to decide which annotations to provide. Furthermore, we use a simple format that is easily edited in a spreadsheet program (including Excel and OpenOffice). We base our standard on the ISA-Tab (Investigation/Study/Assay) format, which is sufficiently extensible to allow easy SNRNASM annotation, is well established, and is widely used for biomedical data sets (Rocca-Serra et al. 2010).
The SNRNASM ISA-Tab format is based on the concept of a multi-tabular spreadsheet. It includes three tabs: “Investigation,” “Study-Assay,” and “Data Matrix.” The Investigation tab contains bibliographical references, authorship, dates, and protocol-related information. In general, a single ISA-Tab file will communicate all data presented in one manuscript. An assay is defined as a mapping experiment using one probe on one nucleic acid, and each row in the Study-Assay tab (Supplemental Fig. 2) corresponds to one such experiment. The actual data is stored in the third Data Matrix tab where each column corresponds to one assay (Supplemental Fig. 2). There is therefore an implicit one-to-one correspondence between rows in the Assays tab and the columns in the Data Matrix tabs. This correspondence is explicitly coded in the Study-Assay tab by a column with Assay Names that correspond to the first row of the Data-Matrix tab.
The Assays tab is where the ontological classification outlined above is used. The Term Accession Number column corresponds to the OBI accession number specifying the type of chemical or enzymatic mapping experiment. Furthermore, other variables (such as monovalent and divalent salt concentration and type) are specified in additional columns in the Assays tab. In principle, any number of experimental conditions can be specified in this way; in practice, only those experimental variables that change (for example, MgCl2 concentration) are recorded. In this way, the most important variables in the experiment are captured systematically.
Creating and sharing an ISA-Tab file
Given that an ISA-Tab file is simply a spreadsheet, specialized software is not required. To simplify the process of creating the appropriate file, we have developed a tutorial document, provided in the supplement of this manuscript and also at the SNRNASM website (http://snrnasm.bio.unc.edu/SNRNASM_Tutorial.pdf). Additionally, links to template ISA-Tab files and example data sets are also available online. Column and row headers are colored in green and yellow, indicating fields that require user input or not, respectively. In practice, most users will simply download an example ISA-Tab file and modify it according to their needs. In most cases, data can be simply pasted into the template to produce a new ISA-Tab file, greatly reducing the burden of data sharing. Alternatively, ISAcreator (http://isatab.sourceforge.net/isacreator.html) used in combination with dedicated configurations (http://tinyurl.com/69r7au3) can provide the necessary support for managing structure mapping data locally prior to release. It is an easy to use tool that automatically helps create and populate ISA-Tab files as well as organize data in the lab. Controlled vocabularies ease data reporting while reducing annotation ambiguity. The capability to save ISA-Tab reports as Google spreadsheets directly from ISAcreator tool is currently being developed and will facilitate sharing.
As mentioned above, we propose a distributed approach to storing ISA-Tab files. Therefore, we have not created a central server where such data are to be uploaded. Instead users may choose to upload their ISA-Tab files to their own servers, or alternatively make them publically available through a free cloud service like Google Docs. Instructions on how to make data public are provided in the tutorial. One advantage of making data available in the cloud is that it allows us to leverage web search engines to find SNRNASM data. Links to the SNRNASM data from pages that are already indexed will facilitate discovery by automated Internet crawling engines. We therefore encourage users to link to their data from their homepages, as well as from the primary publication. Additionally, we link to any SNRNASM data submitted to http://snrnasm.bio.unc.edu. We have also created an automated ISA-Tab validation tool for SNRNASM data at http://rmdb.stanford.edu/repository/tools/validate/ that will identify inconsistencies in a file.
APPLICATIONS
Example use cases
The most likely SNRNASM use case is also the most straightforward in terms of implementation. An investigator reads a paper in which structure-mapping data was collected and wishes to reanalyze these data in a new context. Rather than having to extract the data from a pdf in the supplement, the original SNRNASM data can be obtained in a format that is easily parsed (Fig. 1B). Alternatively, the user can search for SNRNASM data and the names of the authors.
As mentioned above, solution conditions (especially monovalent and divalent cation concentration) significantly alter the three-dimensional (3D) conformation of RNA (Heilman-Miller et al. 2001a; Takamoto et al. 2002, 2004; Koculi et al. 2007). Chemical and enzymatic probes are often used to study the effects of solution conditions on the structure of RNA (Vary and Vournakis 1984b; Celander and Cech 1991; Mathews et al. 1997; Uchida et al. 2003; Takamoto et al. 2004).
To illustrate the value of sharing chemical and enzymatic mapping data, we performed a simple meta-analysis of the effects of solution conditions on the DMS (OBI:0001015) accessibilities of functional RNA residues. Specifically, we wanted to find DMS structure mapping data that were collected under similar divalent solution conditions for different RNAs. We therefore searched for SNRNASM files containing the terms OBI:0001015 and CHEBI:6636 (MgCl2), and identified two studies where DMS chemical mapping data were collected on RNA in the absence and in the presence of 10 mM MgCl2. In the first study, DMS chemical mapping data were collected on sequence variants of the SRP (Signal Recognition Particle) domain IV motif (Das et al. 2010), while in the second study, data was collected on the P4–P6 subdomain of the L-21 Tetrahymena thermophila group I intron (Quarrier et al. 2010). SNRNASM classification therefore facilitated identification of similar data sets for meta-analysis.
Because SNRNASM data files provide easy access to the data, rapidly generating new visualizations is greatly simplified. We used a tool to project structure mapping data on an RNA secondary structure diagram provided with the SAFA software (Das et al. 2005) to visualize the DMS data from these experiments on two-dimensional (2D) representations of the RNA (Fig. 3). What is immediately apparent from our visualization of the DMS mapping data is that the addition of 10 mM MgCl2 results in significant changes in the overall DMS reactivity for P4–P6 (Fig. 3A) and, to a lesser degree, for the SRP domain IV motif (Fig. 3B). The effects of this structural change are visible when comparing the no-Mg2+ and plus-Mg2+ data sets for the P4P6 domain (Fig. 3A), which includes significant tertiary contact formation upon folding (Deras et al. 2000; Doherty and Doudna 2001; Russell et al. 2002, 2006).
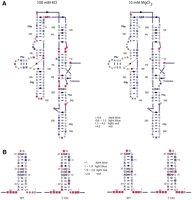
Example meta-analysis of DMS (OBI:0001015) chemical mapping data from two separate studies on RNA. For example, to visualize the effects of Mg2+ on the DMS reactivity of nucleic acids, we searched for OBI:0001015 (DMS) and CHEBI:6636 (MgCl2) in ISA-Tab (Rocca-Serra et al. 2010) files and identified two studies where RNA was probed with DMS in the absence and presence of Mg2+. We then downloaded the two ISA-Tab files (https://spreadsheets.google.com/ccc?key=0As58Pw6ZT3UtdGFveExsek9tdUJNS0xXbUFmRE1ZR0E&hl=en#gid=1 and https://spreadsheets.google.com/ccc?key=0AvCayBYdTclldEJoQ3otbWE5RGx0VzdobmVjX2Q5b3c&hl=en#gid=0) and used a tool included in the SAFA software (Simmons et al. 2009) to visualize the data on the RNA. (A) Secondary structure diagram of the L-21 T. thermophila group I intron with DMS data mapped to its secondary structure with (right) and without (left) Mg2+ present. (B) Secondary structure diagram of domain IV of SRP with and without Mg2+ present.
Interestingly, subtle effects in DMS reactivity are also observed upon Mg2+ addition to the SRP domain IV hairpin (Fig. 3B). No tertiary contacts are present in this RNA, so one might expect the DMS reactivity to be identical in both solution conditions. This domain was chosen for study because it is composed of a series of noncanonical base pairs (indicated using the Leontis-Westhof nomenclature in Figure 3B (Leontis and Westhof 2003). The relationships between 3D structure and chemical reactivity are not simple, but the availability of large numbers of quantitative data sets like the two we analyzed here will allow us to better analyze these relationships in a quantitative and predictive manner (Woodson 2000; Heilman-Miller et al. 2001b; Koculi et al. 2006; Laederach et al. 2007).
DISCUSSION
Our objective in this work is to establish a simple and robust standard that facilitates sharing of single nucleotide resolution nucleic acid structure mapping (SNRNASM) data. To achieve this objective, we:
-
Describe and classify common SNRNASM experiments using a standardized (ontological) vocabulary.
-
Develop a standard format for reporting probing data that is easily read both by humans and computers.
-
Provide a means by which to make these data widely available.
Our SNRNASM classification depends on several ontologies, including the Ontology of Biomedical Investigations (OBI) (Whetzel et al. 2006), the Chemical Entities for Biomedical Investigations (CHEBI) (Degtyarenko et al. 2008, 2009), the Protein Ontology (PRO) (Natale et al. 2007, 2011), and the RNA Ontology (RNAO) (Leontis et al. 2006; Brown et al. 2009; Hoehndorf et al. 2011). SNRNASM experiments are described as assays in OBI, with the input being the nucleic acid and the chemical or enzymatic probe, while the output is a measurement of reactivity. We have added the chemical probes that were not already in CHEBI (Table 1) to uniquely identify the OBI inputs. Similarly, for the nucleases used for enzymatic probing, we obtained unique Protein Ontology identifiers (Table 1). This allows us to uniquely identify each SNRNASM type and assign it an OBI identifier (Fig. 2). The RNA Ontology (RNAO) annotates crucial structural features of RNA molecules extracted from atomic-resolution 3D structures, including all non-Watson–Crick base pairs (Leontis et al. 2006; Brown et al. 2009; Hoehndorf et al. 2011).
We sought to be as inclusive as possible, and any omissions from the SNRNASM techniques (described in Fig. 2 and Table 1) are inadvertent. These are publically available and can easily be updated by community input (available at http://bit.ly/d51yNY); thus, expanding the SNRNASM classification is straightforward. Our criteria for including an assay into our classification require: a primary publication, that the assay either modifies or cleaves a nucleic acid, that the data can be interpreted structurally, and that the modification or cleavage is localized to a specific nucleotide. The list of SNRNASM assays reported in Table 1 therefore represents a starting point for the classification of these experimental techniques and will evolve as new methods are developed. We defined two broad classes of SNRNASMs, chemical and enzymatic (Fig. 2). It is likely that new categories of SNRNASM will be required in the future. Advances in deep sequencing and other genome-wide techniques will lead to whole- or large-scale transcriptome analysis in a single experiment (Kertesz et al. 2010; Mauger and Weeks 2010; Underwood et al. 2010). These experiments generate large amounts of data and will require a systematic approach for documenting and distributing results accurately and efficiently.
This standardization effort represents the beginning of a community effort to make SNRNASM data widely accessible, to facilitate quantitative comparative analysis, to establish predictive relationships between nucleic acid structure and chemical or enzymatic reactivity, and to provide the software and algorithm development communities with essential data for training and validation. By enabling large-scale meta-analysis, it may become possible to discover new approaches for interpreting the results of SNRNASM assays. We therefore strongly encourage laboratories carrying out these assays to make their data available upon publication.
SUPPLEMENTAL MATERIAL
Supplemental material is available for this article.
ACKNOWLEDGMENTS
Workshops allowing the co-authors to develop the SNRNASM standards were made possible through the RNA Ontology Consortium US National Science Foundation Grant #0443508. This work was also funded in part through NIH grants R21MH087336, R00GM079953, R01GM07648, R01AI068462, and the Howard Hughes Medical Institute (HHMI), a Burroughs-Wellcome CASI award (to R.D.), and a Stanford Graduate Fellowship (to P.C.)
Footnotes
-
↵11 Corresponding author.
E-mail alain{at}unc.edu.
-
Article published online ahead of print. Article and publication date are at http://www.rnajournal.org/cgi/doi/10.1261/rna.2753211.
- Received March 28, 2011.
- Accepted April 23, 2011.
- Copyright © 2011 RNA Society
Freely available online through the RNA Open Access option.




