


Monitoring viral RNA in infected cells with LNA flow-FISH
- 1Laboratory for Biosensors and Biomaterials, Code 6910, Center for Bio/Molecular Science and Engineering, Naval Research Laboratory, Washington, District of Columbia 20375, USA
- 2Department of Molecular and Microbiology, George Mason University, Manassas, Virginia 20110, USA
- 3Laboratory of Infectious Diseases, Department of Health and Human Services, National Institute of Allergies and Infectious Diseases, National Institutes of Health, Bethesda, Maryland 20892, USA
Abstract
We previously showed the feasibility of using locked nucleic acid (LNA) for flow cytometric–fluorescence in situ hybridization (LNA flow-FISH) detection of a target cellular mRNA. Here we demonstrate how the method can be used to monitor viral RNA in infected cells. We compared the results of the LNA flow-FISH with other methods of quantifying virus replication, including the use of an enhanced green fluorescent protein (EGFP) viral construct and quantitative reverse-transcription polymerase chain reaction. We found that an LNA probe complementary to Sindbis virus RNA is able to track the increase in viral RNA over time in early infection. In addition, this method is comparable to the EGFP construct in sensitivity, with both peaking around 3 h and at the same level of infected cells. Finally, we observed that the LNA flow-FISH method responds to the decrease in levels of viral RNA caused by antiviral medication. This technique represents a straightforward way to monitor viral infection in cells and is easily applicable to any virus.
Keywords
INTRODUCTION
The ability to detect and study viruses is of great importance for biomedical and biotechnological applications, and for detection of biowarfare agents. Because viruses cause many human diseases, it is critical that we collect valuable information on viral nucleic acids, life cycles, and infection characteristics. Methods that allow the study of these characteristics are valuable for advancing the development of vaccines and therapies to prevent and treat viral infections.
Currently, there are many methods used for the detection and study of viruses, all of which have particular benefits and limitations. Antibodies are widely used to detect viruses and viral proteins (Cho et al. 1996; Bentzen et al. 2005; Dawson 2007; Rabenau et al. 2007; Polage and Petti 2009), but due to their specificity, must be produced and calibrated for every target and are highly vulnerable to viral mutations. Quantitative reverse-transcription polymerase chain reaction (qRT-PCR), microarrays, and enzyme-linked immunosorbent assays (ELISAs) are other widely used methods to detect and quantify viruses (Steininger et al. 2002; Wang et al. 2002; Fox 2007; Leski et al. 2009; Mosleh et al. 2009). While these methods are highly sensitive, they each have shortcomings. Because cells must be lysed prior to these assays, neither is able to provide information about viral viability, infected cell phenotypes, or the relationship between cells and cytopathic phenotypes. In addition, since the signal is averaged over the number of input cells that are lysed, one cannot associate a signal with an individual cell or determine the distribution of infection in cellular populations. Traditional plaque assays, while widely used, are time consuming and rely on cytopathic effects, which are not produced by all viruses or may take long periods of time to occur (Los 2006). In addition, plaque assays are unable to detect noninfectious viruses, which decreases the sensitivity of the assay. Other methods involve the genetic recombination of the virus to express a fluorescent protein upon transcription of the viral genome, which is then translated by the host cell (Thach and Stenger 2003; Sanz et al. 2007; Delehanty et al. 2008). While the signal corresponds with the amount of virus present in individual cells, this technique involves a large initial investment of labor for each virus of interest and changes the nature and pathological phenotypes of the virus.
Fluorescence in situ hybridization (FISH) combined with flow cytometry (flow-FISH) has the potential to overcome many of the issues with traditional virus detection assays. Flow-FISH has been used for telomere length determination, the analysis of microorganisms, and the detection of messenger RNA (mRNA) and viral RNA (Bauman et al. 1990; Bayer and Bauman 1990; Belloc et al. 1993; Belloc and Durrieu 1994; Stowe et al. 1998; Baerlocher et al. 2002). In flow-FISH each cell is treated as an independent observation, thereby enabling the detection of cells containing specific nucleic acid sequences and the quantification of the number of infected cells in a population. Flow-FISH also allows for multiplexed detection of viral nucleic acids, as well as host nucleic acids of interest. This enables researchers to positively verify the presence of virus and correlate that information directly to the changes in host genes in each individual cell. In addition, flow cytometry allows the analysis of a large number of cells and the detection of rare cells in mixed solutions.
While FISH and flow-FISH have been used previously to detect and study viruses (Lizard et al. 1993; Borzì et al. 1996; Crouch et al. 1997; Just et al. 1998; Stowe et al. 1998; Mulrooney and Michalak 2003; Vermeulen et al. 2007), these techniques can be time consuming, with limitations in sensitivity and resolution. As we have discussed elsewhere (Robertson and Thach 2009) the use of high affinity nucleic acid analogs has been shown to increase the sensitivity and specificity of the technique (Taneja 1998; Thomsen et al. 2005). While the nucleic acid analog, peptide nucleic acid (PNA), has been used for the detection of viral nucleic acids in the past (Just et al. 1998), locked nucleic acid (LNA) binds to complementary DNA and RNA with higher affinity than analogous PNA and is superior to PNA for many applications (Braasch and Corey 2001; Elayadi et al. 2002; Robertson and Thach 2009). In LNA, the ribose sugar is constrained by a methylene bridge between 2′-oxygen and 4′-carbon, resulting in an N-type (3-endo) conformation (Obika et al. 1997; Koshkin et al. 1998) that dramatically increases the melting temperature (Tm) of the double-stranded oligomer (Koshkin et al. 1998; Braasch and Corey 2001). LNA-modified oligonucleotide probes have been shown to be superior to DNA probes in many areas, including their sensitivity and specificity for FISH (Silahtaroglu et al. 2003, 2004; Thomsen et al. 2005; Kubota et al. 2006).
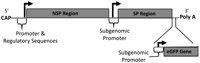
We have recently reported on the development of an LNA-based flow-FISH method for mRNA detection (Robertson and Thach 2009), and here we use LNA flow-FISH for the quantitative and sensitive detection of intracellular RNA in a viral-infection model using Sindbis virus (SV). SV is the prototype virus for the genus αvirus and the family togaviridae. SV is a positive, single-stranded RNA virus whose genomic RNA serves as the mRNA for translation of the viral proteins, as well as the template for synthesis of the complementary minus-strand (Kuhn 2007). The genome can be divided up into two regions, the nonstructural protein (NSP) region and the subgenomic structural protein (SP) region (Scheme 1). The SV SPs are translated from the subgenomic RNA early (2–3 h post-infection) in the replication cycle, probably as soon as the subgenomic mRNA is formed.
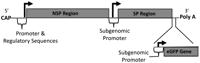
Schematic of the Sindbis virus genome outlining the structural and nonstructural protein regions (data adapted from Cheng et al. 1996). The SV LNA is complementary to the structural protein region.
We build upon our previous LNA flow-FISH optimization experience and adapt the method for in vitro monitoring of a viral infection. To our knowledge, this is the first time that the increase in viral RNA has been followed over time with flow-FISH. We infect cells with SV virus and perform flow-FISH at various early time points during infection. In addition, we compare and confirm our results with two other methods for viral detection (EGFP viral expression and qRT-PCR) and test the LNA flow-FISH method for use in antiviral drug research.
RESULTS AND DISCUSSION
Specificity of SV LNA probe
For SV RNA detection, a complementary LNA probe was designed to hybridize to the structural protein region of the viral RNA genome (Scheme 1). This region encodes for the structural proteins and is transcribed at a higher rate than that of the nonstructural region (Kuhn 2007). The signal from the SV LNA probe was tested for specific binding in BHK cells in the absence of infection (Fig. 1A; “No Infection”) and at various times post-infection (Fig. 1B shows 4-h post-infection only). In the absence of infection, the SV LNA does not exhibit any nonspecific binding and, in fact, gives a slightly lower signal than the nonspecific LNA (Fig. 1A). At 4-h post-infection, the SV LNA probe shows a signal that correlates with increased SV RNA from virus replication (Fig. 1B). From the flow signals, one can also see that the SV LNA is detecting only the infected cells, while the uninfected cells (or infected cells that contain little or no quantity of SV RNA) are giving a signal in a region that corresponds with the nonspecific LNA signal. Overall, the LNA probe designed for SV RNA was found to be able to easily distinguish the proportion of cells that are infected and undergoing viral replication from the population that is either not infected or not in an actively replicating state (Fig. 1A,B).
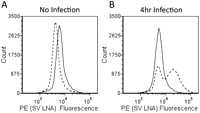
Specificity of SV LNA probe. (A) No infection; (B) 4-h infection; nonspecific LNA (solid line), SV LNA (dotted line).
Monitoring viral infections
In the SV construct used here (Scheme 1) a gene encoding enhanced green-fluorescent protein (EGFP) was placed under control of a promoter that is identical to the promoter of the viral structural proteins. Therefore, during Sindbis virus replication, infected cells are expected to produce intracellular EGFP at levels proportional to the viral structural proteins (Thach and Stenger 2003; Delehanty et al. 2008). This feature was used to make a direct comparison of the EGFP protein detection with the SV RNA LNA detection.
Figure 2, A and B, compare the flow cytometry histograms for the LNA flow-FISH and EGFP techniques at points corresponding to no infection, 1.5, 2, 3, and 8 h post-infection. The EGFP starts showing a shift in signal at 1.5 h, while the LNA flow-FISH can detect the SV RNA at 2 h. This difference is quantitatively displayed in Figure 3, left panel, which shows the number of positive cells for SV at each time point (0, 1.5, 2, 2.5, 3, 4, 6, and 8 h). The EGFP signal increases at a slightly quicker rate than the signal from SV LNA, but both plateau to the same level after 3 h. The same peak-signal levels show that the LNA-flow-FISH method is comparable to the EGFP construct in sensitivity when measured by flow cytometry. The slight differences in dynamics may due to the likelihood that more SV protein is expressed than the RNA template. The advantage of the LNA flow-FISH is that by simply changing the LNA probe, any virus can theoretically be detected, whereas in the case of EGFP, a new viral construct would be necessary for every virus or mutant.
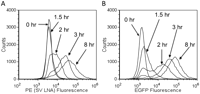
SV LNA flow-FISH versus EGFP detection of Sindbis RNA over time. Histograms showing representative flow cytometry data for specific time points for (A) SV LNA and (B) EGFP.
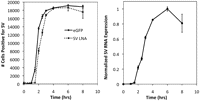
(Left panel) Number of cells positive for SV over time as detected by SV LNA (squares) and EGFP (circles). (Right panel) Normalized qRT-PCR data showing the relative amount of SV RNA at each time. The qRT-PCR data was normalized relative to the no infection expression level. Each point shown is the mean value of three replicates; error bars indicate standard error.
Quantitative RT-PCR
Quantitative RT-PCR was used to confirm the LNA flow-FISH results. A standard curve was produced using viral RNA purified from SV supernatants. The standard curve was used to calculate the SV RNA expression at each time point relative to the expression at the no infection time point (Fig. 3, right panel). Unsurprisingly, qRT-PCR could detect SV RNA in infected cells at the earliest time point of infection (45-min infection or 0-h Infection). Although the qRT-PCR and the LNA flow FISH method began detecting SV RNA at different times, the increases in the SV RNA expression level detected over time are very similar (Fig. 3, both panels).
While qRT-PCR is a highly sensitive technique for viral detection in cell lysates, it provides no information regarding viral viability, individual cell phenotype, infection distribution in cellular populations, or the relationship between the cells and pathological features. In addition, the fast and simple flow-FISH method is inexpensive compared with the cost of primers, probes, and enzymes for qRT-PCR. The LNA flow-FISH method also allows the simultaneous examination of viral nucleic acids as well as host nucleic acids and/or proteins through multiplexing, providing valuable information about host cell response to infection.
Tracking the effects of antiviral drugs
Both LNA-flow-FISH and EGFP fluorescence measurements were used for tracking the effects of the antiviral medication Ribavirin (Rbv). Rbv is a nucleoside analog that inhibits the replication of many DNA and RNA viruses including Sindbis (Malinoski and Stollar 1981). To test the ability of the flow-FISH method to monitor the action of antiviral drugs, samples infected with SV were analyzed with and without Rbv. After a 6-h incubation with Rbv, both the flow-FISH and EGFP results showed a reduction in viral replication and viral expression, respectively (Fig. 4). The controls (no infection, 0 h infection [45 min virus incubation], and 6 h no infection + Rbv) all show no change in SV RNA.
Tracking effects of Ribavirin. Bar graph shows the mean fluorescence intensity of SV LNA flow-FISH versus EGFP.
These results reconfirm that Rbv decreases the ability of the virus to replicate and shows the utility of the LNA flow-FISH method for monitoring SV RNA in the presence of antivirals. While the mechanism of Rbv is known, the additional information provided by the LNA flow-FISH method such as cell viability, cell morphology, and infection distribution, may be able to give insight into the mechanism of other antiviral medications.
CONCLUSION
In conclusion, we have used LNA-modified oligonucleotide probes for the specific and sensitive detection of viral RNA, and show that LNA flow-FISH can be used to follow the initial stages of a viral infection. We compared the LNA flow-FISH method with an EGFP-SV construct and qRT-PCR and found similar results. In addition, we were able to follow the viral infection over time and study the action of antiviral medication.
The flow-FISH method described here utilizes one LNA probe and one fluorophore in contrast to many other flow-FISH methods, which need two or more oligonucleotide probes for detection (Borzì et al. 1996; Crouch et al. 1997; Just et al. 1998; Stowe et al. 1998; Narimatsu and Patterson 2005). With small changes such as the addition of a second biotin at the 3′ end of the probe or the addition of a second or third LNA probe complementary to the same RNA, the fluorescence signal and sensitivity could be increased dramatically. While other flow-FISH methods have been described that utilize PCR-based in situ hybridization to enhance sensitivity, it also increases the cost and the complexity (Patterson et al. 1993; Cho et al. 1996). The use of the LNA flow-FISH method provides a highly generic, cost-effective, and simple technique, which can be easily applied to other viruses and used prior to other more costly and time-consuming techniques.
LNA flow-FISH could be used alone or in tandem with the other methods tested here to provide complementary information on viral infection and viral nucleic acid replication and transcription. This technique is easily applicable to any virus by substituting the LNA probe and is superior to the other methods examined here because of its simplicity. Due to the ability to add additional probes for multiplexing, this technique can be used to develop transcript regulatory networks, which can be used to better understand infectious agents.
MATERIALS AND METHODS
Cell culture for SV stocks
BHK-21 cells (American Type Culture Collection) were grown in Dulbecco's modified Eagle's medium (DMEM) supplemented with 10% fetal bovine serum (FBS) (Cellgro) and 1% (v/v) penicillin/streptomycin (Sigma) and detached from culture flasks using trypsin-ethylenediamine-tetraacetic acid (EDTA) (Cellgro). Cells were grown in either tissue culture flasks or 6-well plates and incubated at 37°C under 5% CO2 atmosphere.
Sindbis virus stocks
Recombinant Sindbis virus (SV) (633-EGFP strain) was generously provided by Dr. Diane Griffin (Johns Hopkins University). This virus contains a gene that encodes enhanced green fluorescent protein (EGFP), which is under the control of the same promoter that controls the transcription of the viral subgenomic RNA encoding structural proteins (Scheme 1). The virus seed stock was expanded by infecting BHK cells under serum-free conditions. BHK cells were grown in T150 cm2 tissue culture flasks until ∼90% confluency. The cells were then washed with Dulbecco's PBS and infected with SV at a multiplicity of infection (MOI) of one plaque forming unit (pfu) per cell in 2 mL of serum-free VP-SFM medium (GIBCO). After 1 h of incubation at 37°C, an additional 13 mL of VP-SFM was added. The cells were allowed to incubate overnight with the virus and were observed the next day for signs of cytopathic effects. The supernatant was collected, centrifuged to remove cellular debris, aliquoted, and stored at −80°C.
Quantification of SV supernatant stock by plaque assay
Each well of a 6-well plate was seeded with 3 × 10⁵ BHK cells and allowed to form a monolayer overnight. The next day, serial dilutions of the viral supernatant were prepared in 1% FBS DMEM. An aliquot (200 uL) from each dilution was then incubated with the BHK monolayer for 1 h at 37°C, with rocking every 10 min. After 1 h, the cells were overlayed with warm, melted 1.2% Bacto agar in water mixed with an equal volume of 2X MEM (GIBCO). The overlay medium was allowed to solidify at room temperature; then the plates were incubated at 37°C for 48 h to allow for plaque formation. Subsequently, the cells were stained with 0.03% neutral red in DPBS (Sigma) with 1X MEM. After 2 h of staining, the stain was removed, and the plaques were observed and counted. The pfu/mL in the original supernatant was calculated based on the number of plaques observed and the dilution factor.
LNA probes
One control oligonucleotide and one specific biotinylated LNA-modified DNA oligonucleotide were used for the quantification of SV RNA. Both were purchased from IDT. The control probe is a nonspecific oligonucleotide (nonspecific LNA) with no complementarity with any cellular nucleic acids and has the sequence 5′-biotin-gtGtaAcaCgtCtaTacGccCa-3′ (Tm = 75°C, LNA monomers in uppercase letters). The specific LNA probe (SV LNA), complementary to the SV RNA portion encoding the structural proteins, has the sequence 5′-biotin-tCttCttCccAcaCagCgaTac-3′ (Tm = 76°C). The Tm's of the probes were estimated using the Exiqon Tm prediction program (http://lna-tm.com) (Tolstrup et al. 2003).
SV infection time course for LNA-flow, EGFP-flow, and qRT-PCR
BHK cells were seeded into either T75 cm2 flasks or 6-well plates and grown in complete medium (DMEM, supplemented with 10% FBS and 1% (v/v) penicillin/streptomycin) to ∼90% confluency. The monolayer was washed once with PBS, and either 2 mL (for T75 cm2 flasks) or 0.3 mL (for six-well plates) of virus (MOI 5:1) in VP-SFM was added. The cells were incubated at 37°C with SV for 45 min, with rocking every 10 min. After 45 min, the cells were washed with PBS to remove unbound virus, and either 15 mL (T75 cm2) or 2 mL (six-well plate) of complete medium was added. At various times, from 0 to 8 h post-infection (following the 45-min incubation), the cells were washed with PBS and harvested with trypsin-EDTA. 0 Hour infection is defined here as the cell collected immediately following the 45-min viral incubation period. The no infection samples were incubated for the first 45 min with VP-SFM only, and then collected. Complete media was added, and the cells were centrifuged at 2000 rpm for 5 min. The cells were washed with PBS and split into aliquots for qRT-PCR, EGFP, and flow-FISH measurements. Cells for flow-FISH were fixed in a solution of 4% paraformaldehyde (Electron Microscopy Sciences) and 5% acetic acid in phosphate-buffered saline (PBS) for 10 min at room temperature. After fixation, the cells were washed twice in PBS and stored at 4°C overnight. Cells for EGFP detection were resuspended in PBS and analyzed immediately by flow cytometry for EGFP fluorescence.
Cells for quantitative RT-PCR were pelleted by centrifugation and frozen at −80°C for later RNA extraction. The RNA extraction was performed with an RNeasy Mini Kit (QIAGEN) according to the manufacturers' protocols. The quality of the purified RNA was analyzed by agarose gel electrophoresis and stored at −80°C for use in qRT-PCR.
Viral RNA standard curve
To produce a SV RNA standard for qRT-PCR, viral RNA was extracted from the viral supernatant stock (see above) using the QIAmp Viral RNA Mini Kit (QIAGEN) according to the manufacturer's protocols. The purified SV RNA standard was then quantified spectrophotometrically.
Quantitative RT-PCR
Two-step qRT-PCR was performed on the RNA collected from the viral infections time course and on the SV RNA standard from above. First, cDNA was produced using the RETROscript Kit (Ambion/Applied Biosystems) according to the manufacturers' protocols using 1 μg of total RNA extracted from the cells at each time post-infection. Then qRT-PCR was performed using a Taqman primer/probe set specially designed for the structural protein-encoding region of the SV RNA (Applied Biosystems). The primer and probe sequences used were: forward primer 5′-gagccagtgagggtctatgc-3′, reverse primer 5′-gccatccgtgagggtctc-3′, and probe 5′-FAM-ctggtgctgactcttg-NFQ-3′. For the standard curve, six dilutions were measured and the amount of cDNA used from each sample was adjusted so that all sample Ct values fell within the Ct values from the SV RNA standard curve endpoints. The total SV RNA was then calculated from the linear regression curve fit of the SV RNA standard. The data were normalized to the no infection sample according to the following protocol: (x-x0)/xmax, where x is the value from each time point, x0 is the value of the no infection sample, and xmax is taken from the time point of maximum gene expression.
Flow-FISH
The day following fixation, the cells for flow-FISH were permeabilized with 0.1 μg/mL Proteinase K in TE buffer (pH 8.0) for 30 min at 37°C. The cells were then washed twice with PBS. A prehybridization step was carried out next under the same conditions as regular hybridization, but without the LNA probe to reduce background fluorescence (Pernthaler and Amann 2004). After prehybridization, a solution of 0.1X saline-sodium citrate (SSC) buffer was added to reduce viscosity, followed by centrifugation (3000 rcf) and removal of the supernatant. Hybridization was then carried out in 100 μL hybridization solution containing 20 pmol SV LNA, 50% formamide, 10% dextran sulfate, 50 nM NaPi (pH 7.0), 2X SSC, and 10 μg of sheared salmon sperm DNA (SSSD, Applied Biosystems/Ambion). The sample was denatured for 90 sec at 80°C and incubated at 60°C for 90 min.
Following hybridization, 0.1X SSC buffer was added, the cells were centrifuged, and the supernatant removed. The cells were then washed at 65°C twice with 50% formamide and 2X SSC buffer for 10 min each, and twice with 0.1X SSC buffer for 20 min each. The controls were subjected to the same conditions as above and consisted of either nonspecific LNA or no LNA in place of the SV LNA. Following the washes, the cells were blocked with 1X in situ hybridization blocking buffer (Vector Laboratories). In separate tubes, the cells and PE-conjugated streptavidin were incubated with the blocking solution for 30 min at room temperature. Staining was then performed by adding the PE-conjugated streptavidin in blocking solution to the cells. The cells were then washed twice with 0.1X SSC buffer and twice with PBS for 5 min each at room temperature. The cells were then resuspended in PBS for flow cytometry analysis.
Antiviral studies
To test the flow-FISH technique for antiviral studies, Ribavirin (Rbv) (Sigma), an antiviral nucleoside analog was used. For these studies, BHK cells were grown in T75 cm2 flasks to ∼90% confluency. For the infected samples, the SV was added to the monolayer at an MOI of 5:1 in 2 mL of VP-SFM for 45 min, with rocking every 15 min. For the uninfected samples, 2 mL VP-SFM without SV was added. Following the 45-min incubation, the medium was removed from each flask and the cells were washed with PBS. The 45-min infected control cells were harvested and used for flow cytometry (EGFP) and flow-FISH. Complete media (15 mL) with or without 150 μg/mL Rbv was added to the other flasks and allowed to incubate at 37°C for 6 h.
Flow cytometry and sata nalysis
Flow cytometry analysis was performed using an Accuri C6 flow cytometer equipped with a 488-nm and 635-nm laser and standard emission filters for FITC, PE, PI, and APC. For each sample, 2 × 10⁴ events were collected in a gate corresponding to the cell population.
In order to calculate the number of cells positive for virus, a gate was created to encompass the population of cells on a scatter plot of SSC versus PE intensity (FL-2) that were negative for virus (based on the no infection sample). Cells showing fluorescence intensities greater than this population were taken to be positive for SV.
ACKNOWLEDGMENTS
This work was supported in part by the Office of Naval Research and in part by JSTO-CBD/DTRA Project Number 4.10004.08.NRL.
Footnotes
-
Reprint requests to: Eddie L. Chang, Laboratory for Biosensors and Biomaterials, Code 6910, Center for Bio/Molecular Science and Engineering, Naval Research Laboratory, 4555 Overlook Avenue SW, Washington, DC 20375, USA; e-mail: eddie.chang{at}nrl.navy.mil; fax: (202) 767-9511.
-
Article published online ahead of print. Article and publication date are at http://www.rnajournal.org/cgi/doi/10.1261/rna.2016410.
- Received November 24, 2009.
- Accepted May 20, 2010.
Freely available online through the RNA Open Access option.




