


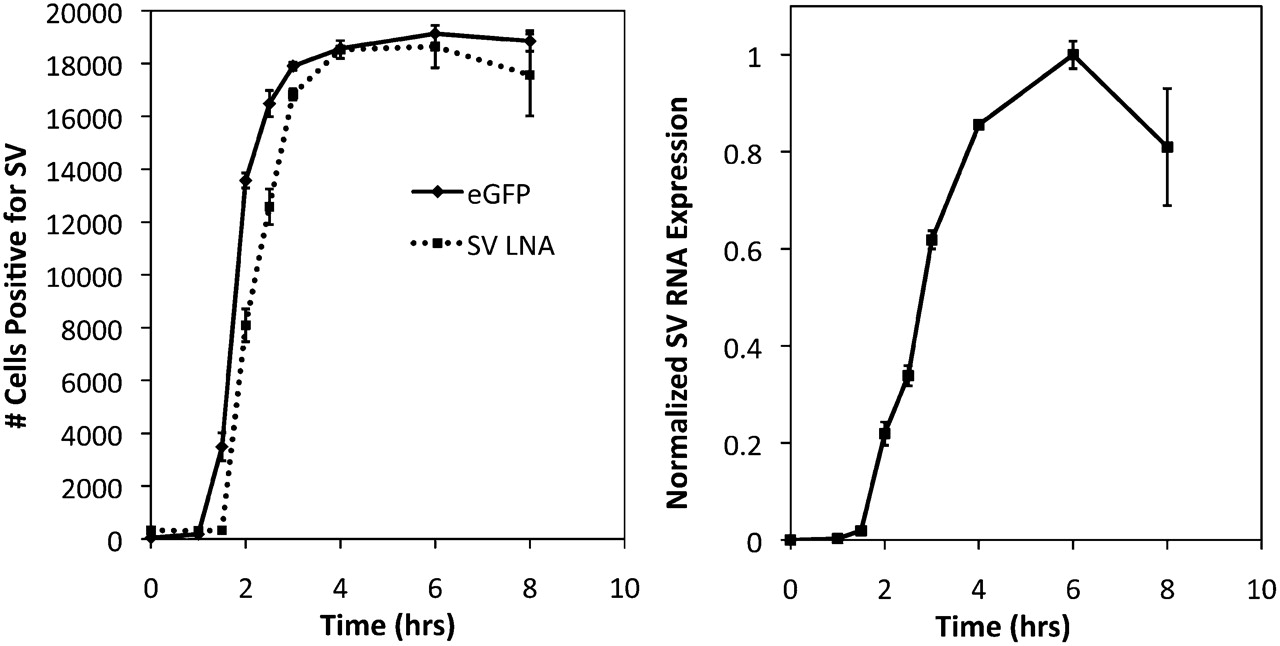
FIGURE 3.
(Left panel) Number of cells positive for SV over time as detected by SV LNA (squares) and EGFP (circles). (Right panel) Normalized qRT-PCR data showing the relative amount of SV RNA at each time. The qRT-PCR data was normalized relative to the no infection expression level. Each point shown is the mean value of three replicates; error bars indicate standard error.




