


FIGURE 2.
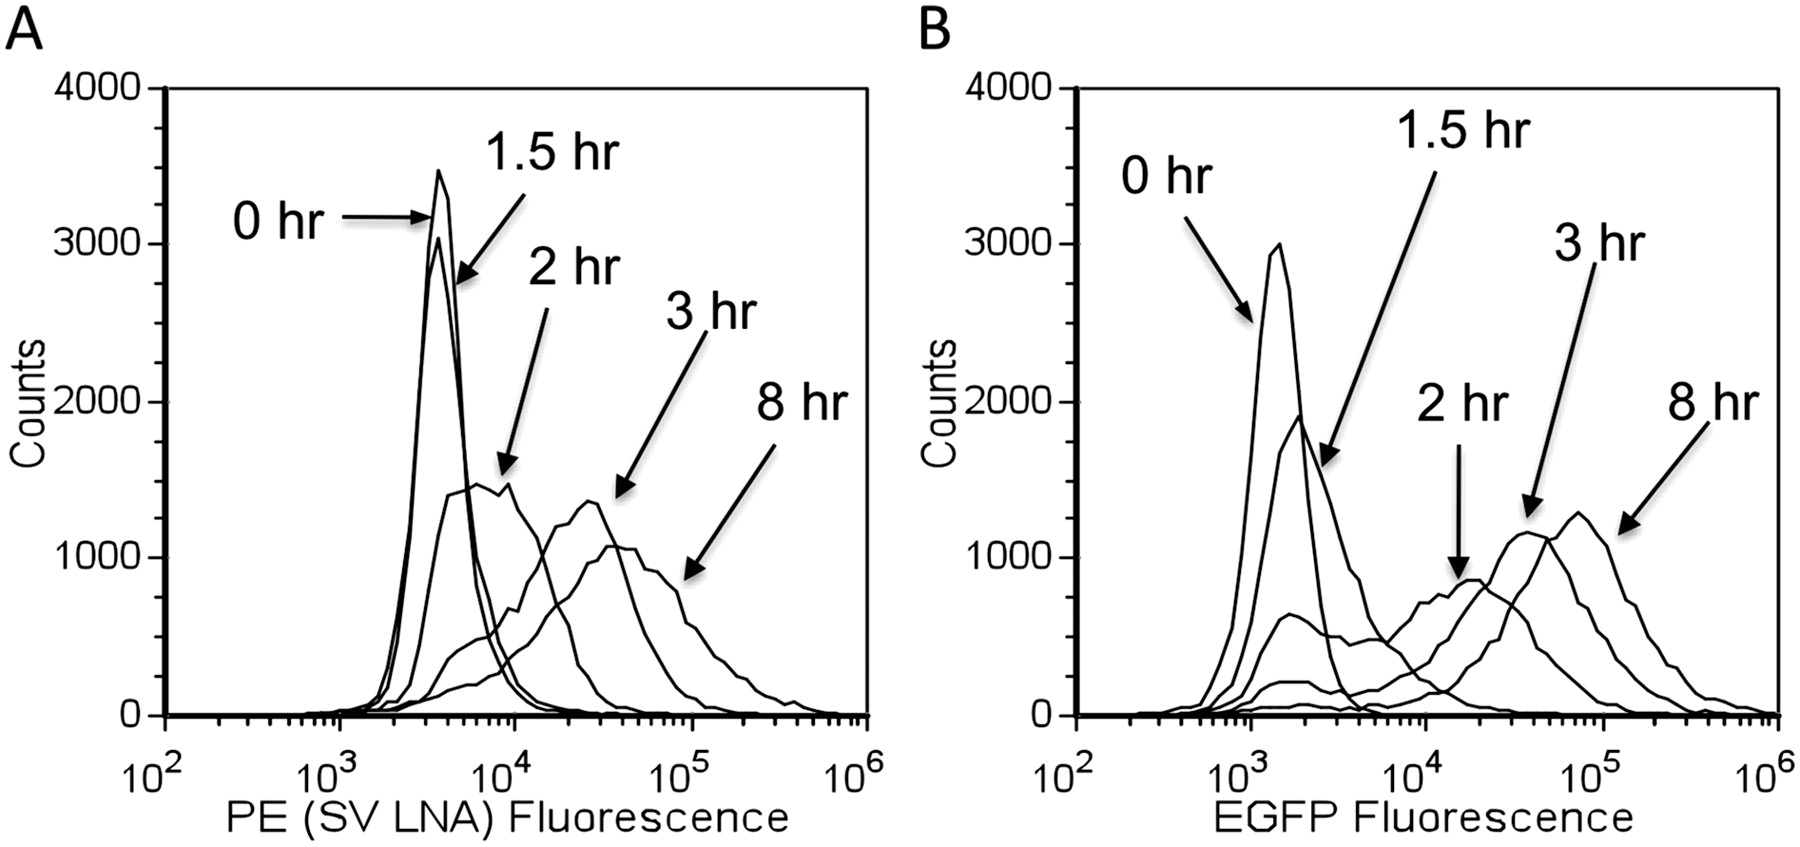
SV LNA flow-FISH versus EGFP detection of Sindbis RNA over time. Histograms showing representative flow cytometry data for specific time points for (A) SV LNA and (B) EGFP.
(Downloading may take up to 30 seconds. If the slide opens in your browser, select File -> Save As to save it.)
Click on image to view larger version.
SV LNA flow-FISH versus EGFP detection of Sindbis RNA over time. Histograms showing representative flow cytometry data for specific time points for (A) SV LNA and (B) EGFP.
 CiteULike
 Delicious
 Digg
Digg Facebook
 Reddit
 Twitter
Molecular Cloning
The New Edition
Buy Now and Save 30%
Paperback only
(limited time offer)

|
Molecular Cloning: A Laboratory Manual (Fourth Edition) |
