


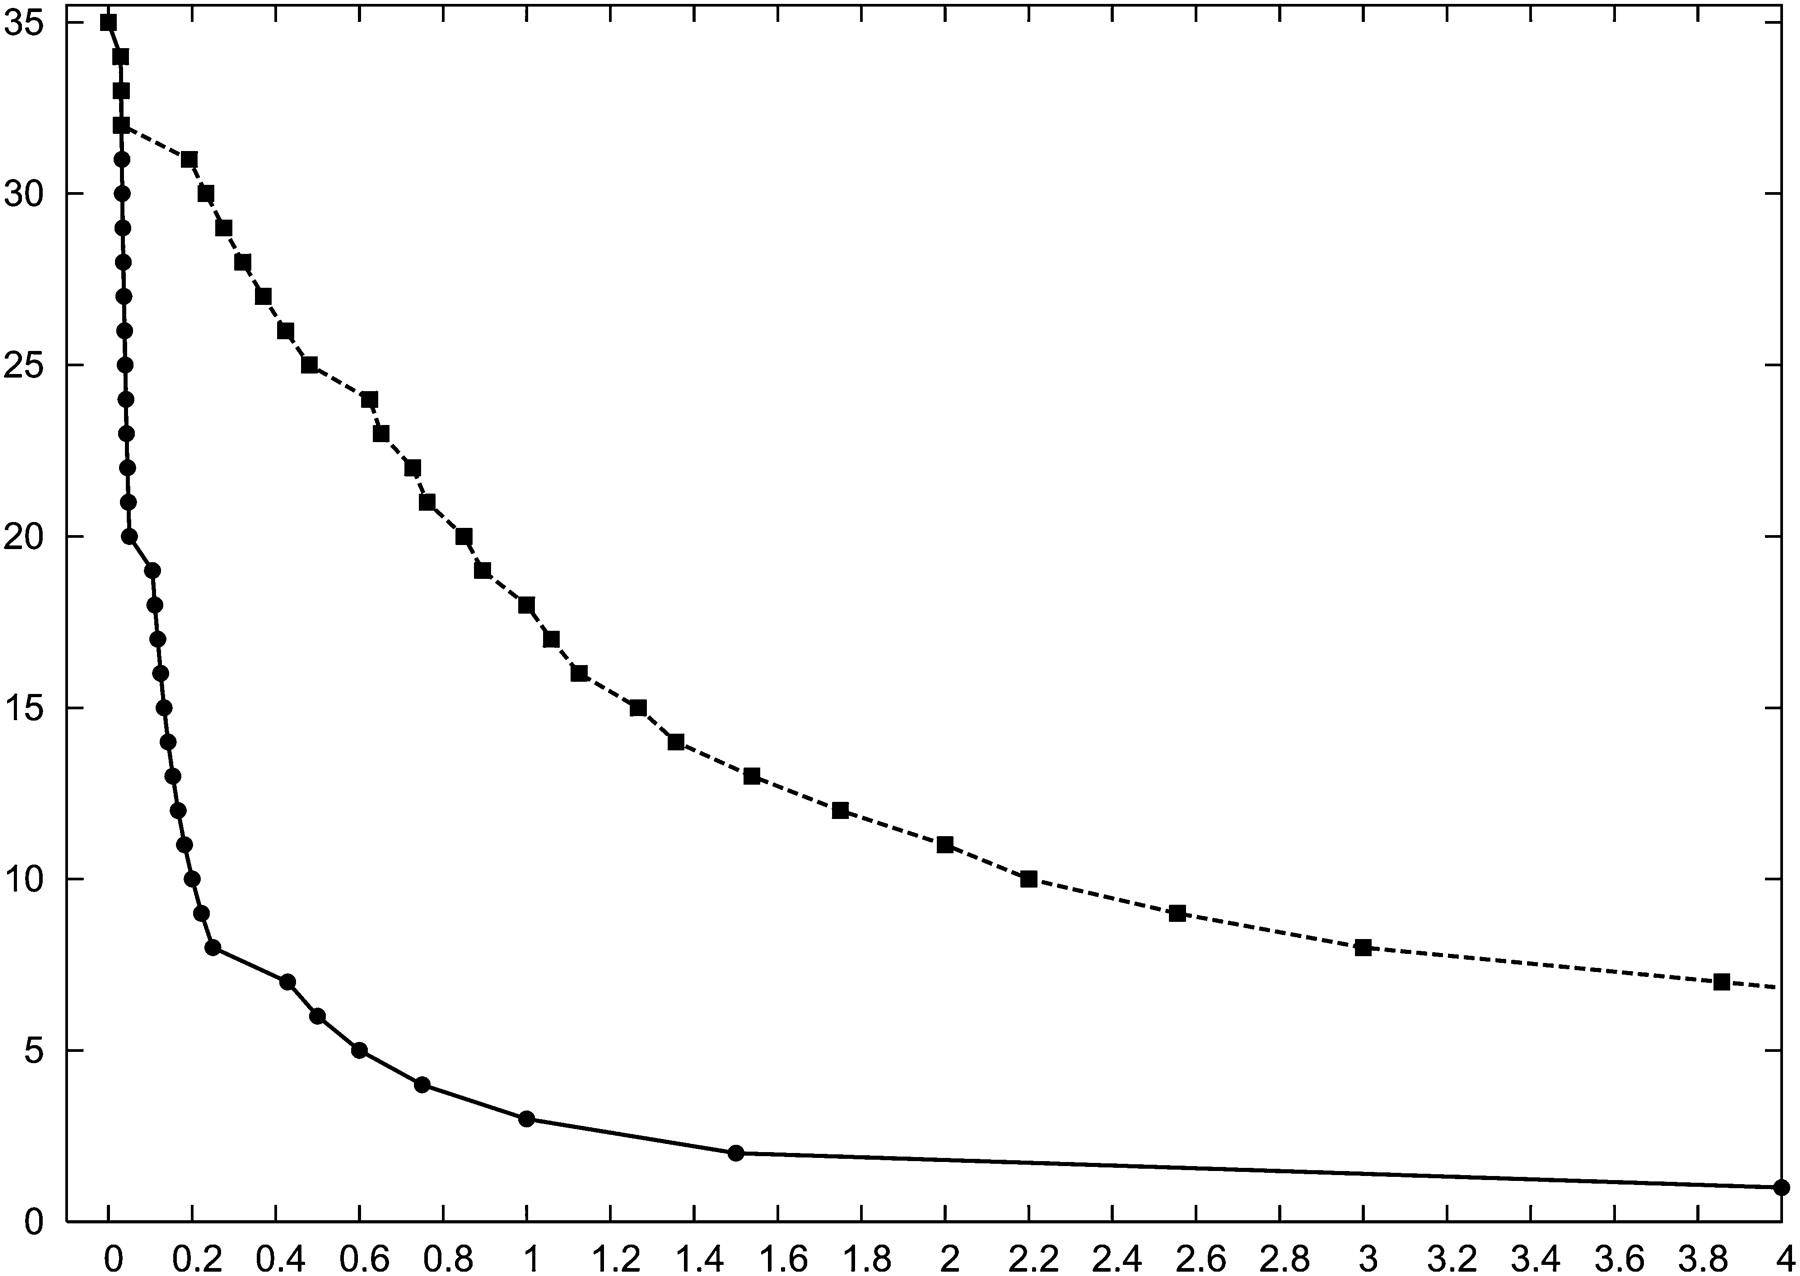
RBP scores (vertical axis) are plotted versus different relaxation parameters (horizontal axis) for two pairs of 5S rRNA secondary structures. (Solid line with circles) ρt(Sphylo, Smfe) versus t, where Sphylo and Smfe are the phylogenetic and mfe structures for M. thermautotrophicus, respectively. (Dashed line with boxes) ρt(Sphylo, Sconsen) versus t, where Sphylo and Sconsen are the phylogenetic and consensus structures for H. japonica, respectively. Values of t are automatically chosen for each plot so that every possible RBP score occurs within the range 0 ≤ t ≤ 4. The RBP score reaches its minimum value of 1 for the M. thermautotrophicus pair when t = 4, so that 35 circles appear in the plot. The two plots coincide for the first four (identical) values of t.




