


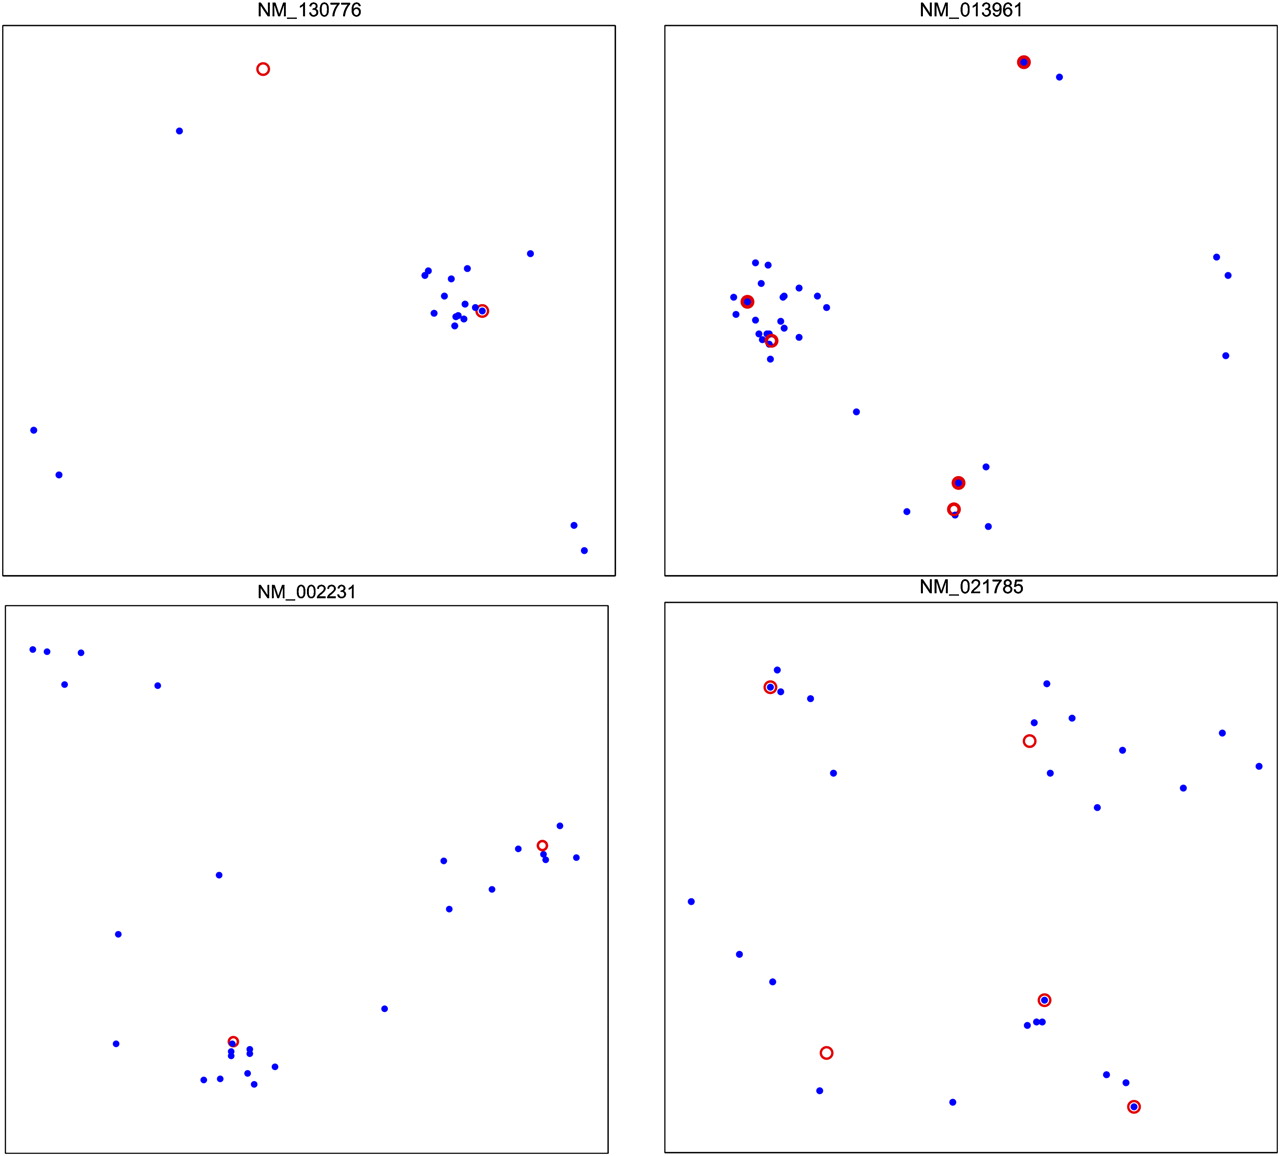
FIGURE 8.
PCA plots of the cluster medioids derived by projecting medioid BP distances into two dimensions. The plots, clockwise from top left, are for NM_130776, NM_013961, NM_021785, and NM_002231. (Red circles) BP metric medioids, (blue dots) all the RBP medioids computed using various t ≠ 0 values.




