


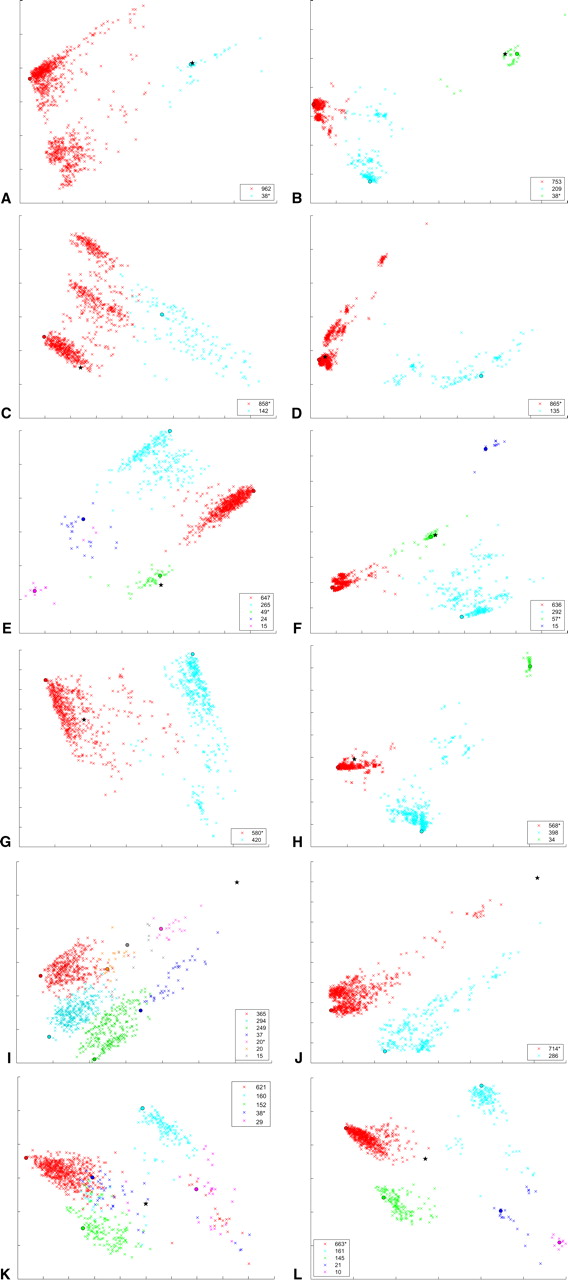
PCA plots for a variety of sequences and values of t. Colored crosses (×) indicate individual structures of the sample. The colors red, cyan, green, blue, magenta, orange, and gray correspond to the largest cluster, the next largest, and so on, respectively. Cluster sizes are shown in the boxed legends. (*) The mfe structure; (○ filled with the cluster color) cluster medioids. The number of clusters is computed automatically for each value of t. Each plot is labeled by LOCUS, t value: (A) NM_130776, 0; (B) NM_130776, 1; (C) NM_016815, 0; (D) NM_016815, 1; (E) NM_013961, 0; (F) NM_013961, 1; (G) NM_002231, 0; (H) NM_002231, 1; (I) NM_000781, 0; (J) NM_000781, 0.1; (K) NM_005656, 0; and (L) NM_005656, 0.1.




