


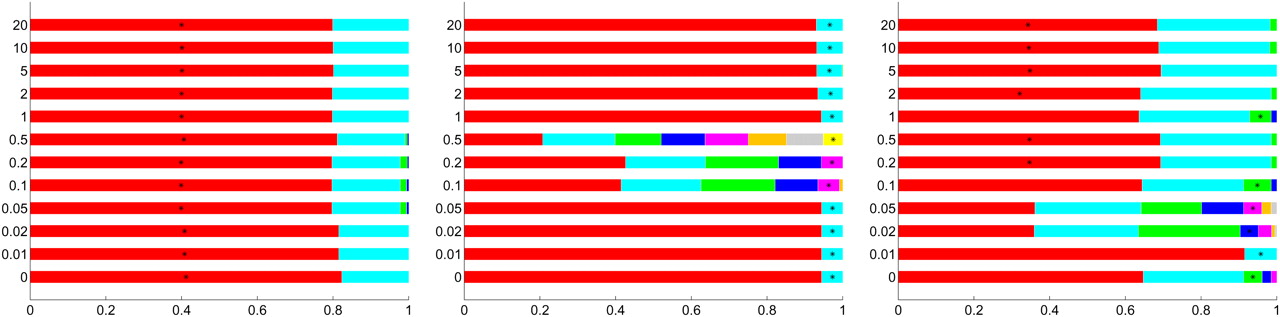
FIGURE 6.
Bar plots for three of the 13 mRNAs: NM_004381 (left), NM_002988 (middle), and NM_013961 (right). Bar lengths indicate cluster sizes (horizontal axis), which sum to 1000. Different bars correspond to different values of the RBP relaxation parameter (t, vertical axis), which increase bottom to top. The colors are used only for visual effect. (*) The cluster, if any, to which the mfe structure is assigned.




