


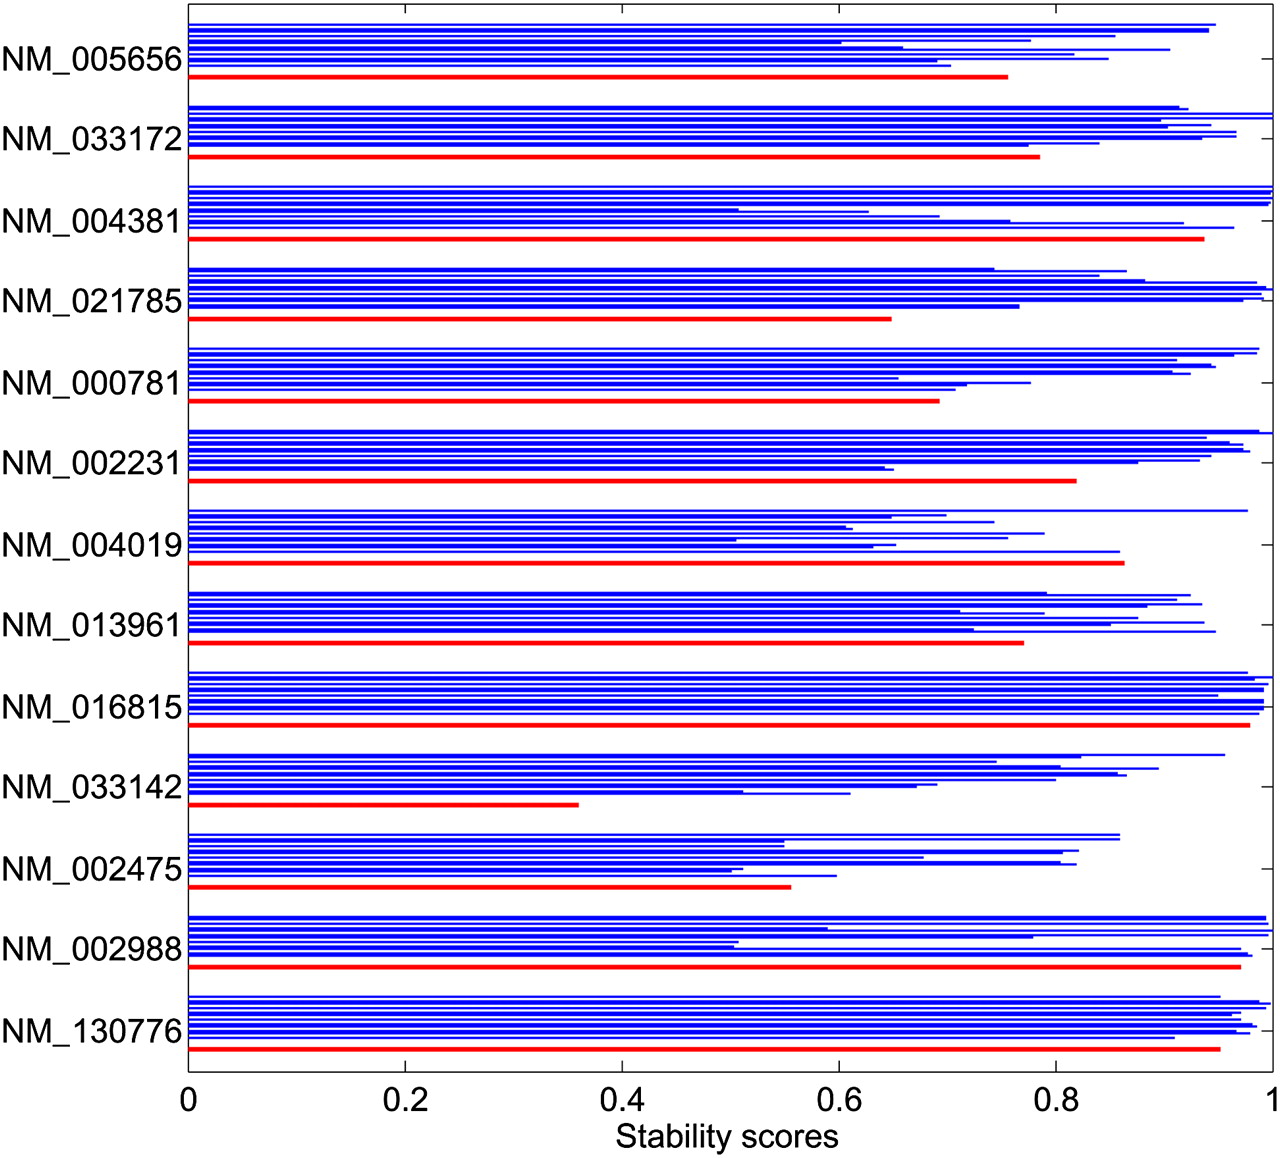
FIGURE 5.
Clustering stability scores (horizontal axis) for the BP metric (t = 0, red) and RBP scores (t > 0, blue) for the 13 sequences listed (vertical axis, with sequences listed in order of length, shortest at the bottom). Stability scores approaching 1 indicate very stable clusters. The RBP relaxation parameters are t = 0.01, 0.02, 0.05, 0.1, 0.2, 0.5, 1, 2, 5, 10, and 20, corresponding to consecutive blue lines, bottom to top, respectively, for each sequence. Higher t values appear to give more stable clusters.




