


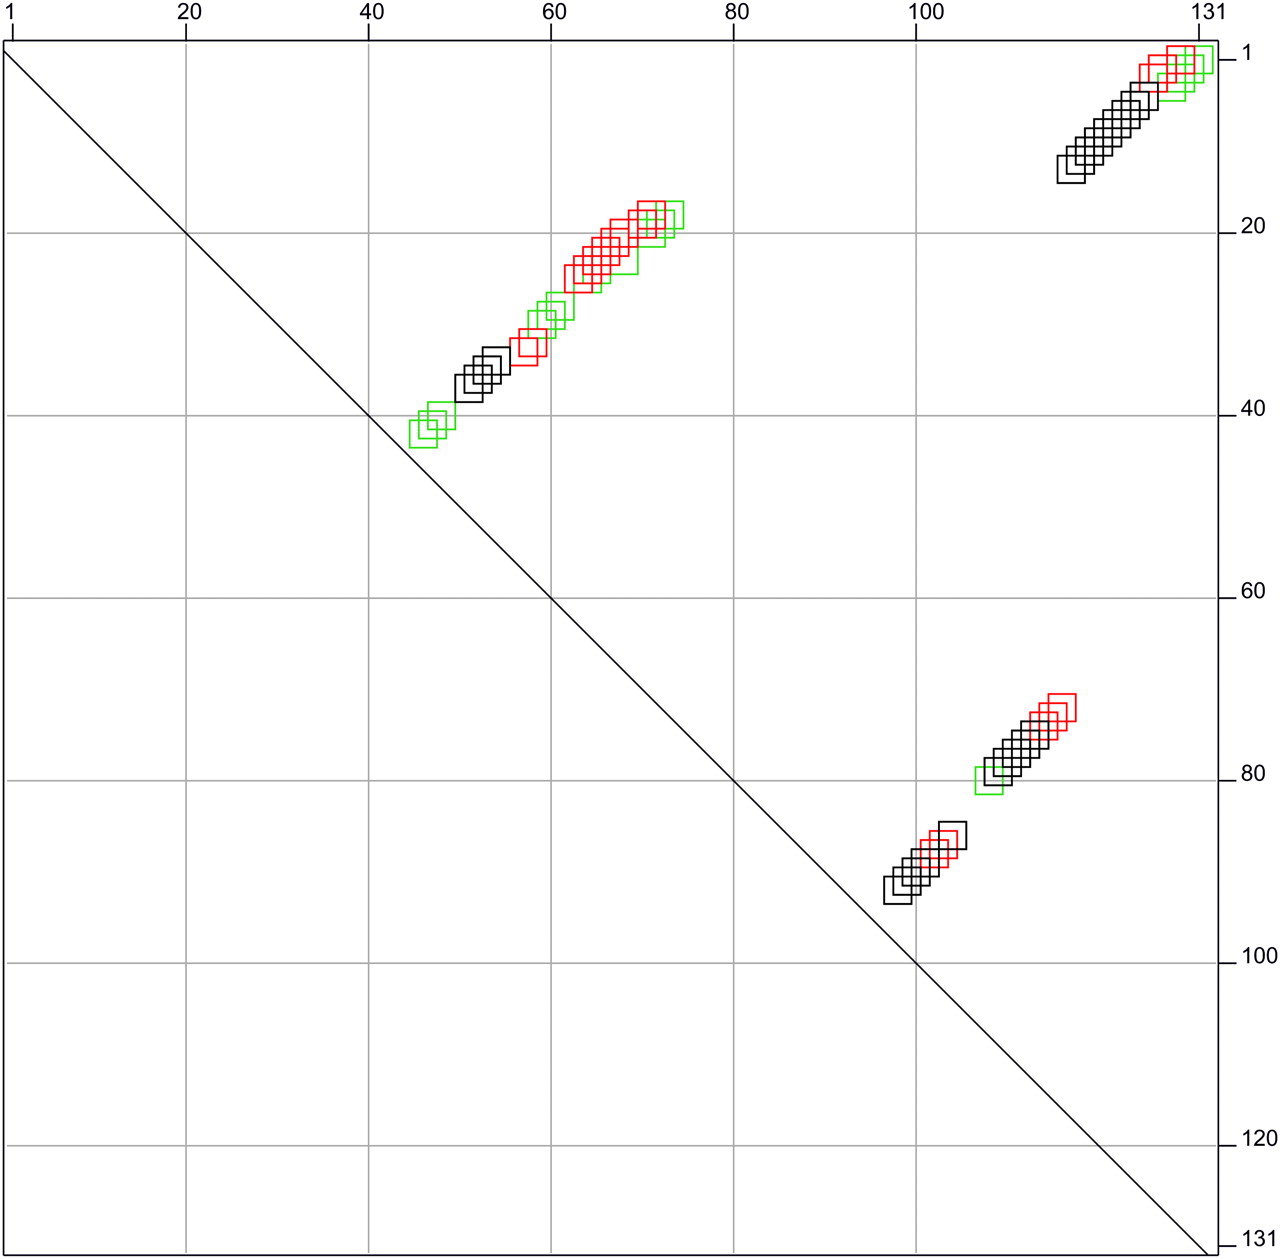
FIGURE 3.
A structure dot plot that superimposes the phylogenetic structure of Methanothermobacter thermautotrophicus 2 5S rRNA (red and black squares) and a mfe structure for the same RNA (green and black squares). In this format, it is easy to visualize structural similarity. The squares are hollow to facilitate recognition of overlapping or touching squares. The squares are all 3 × 3.




