


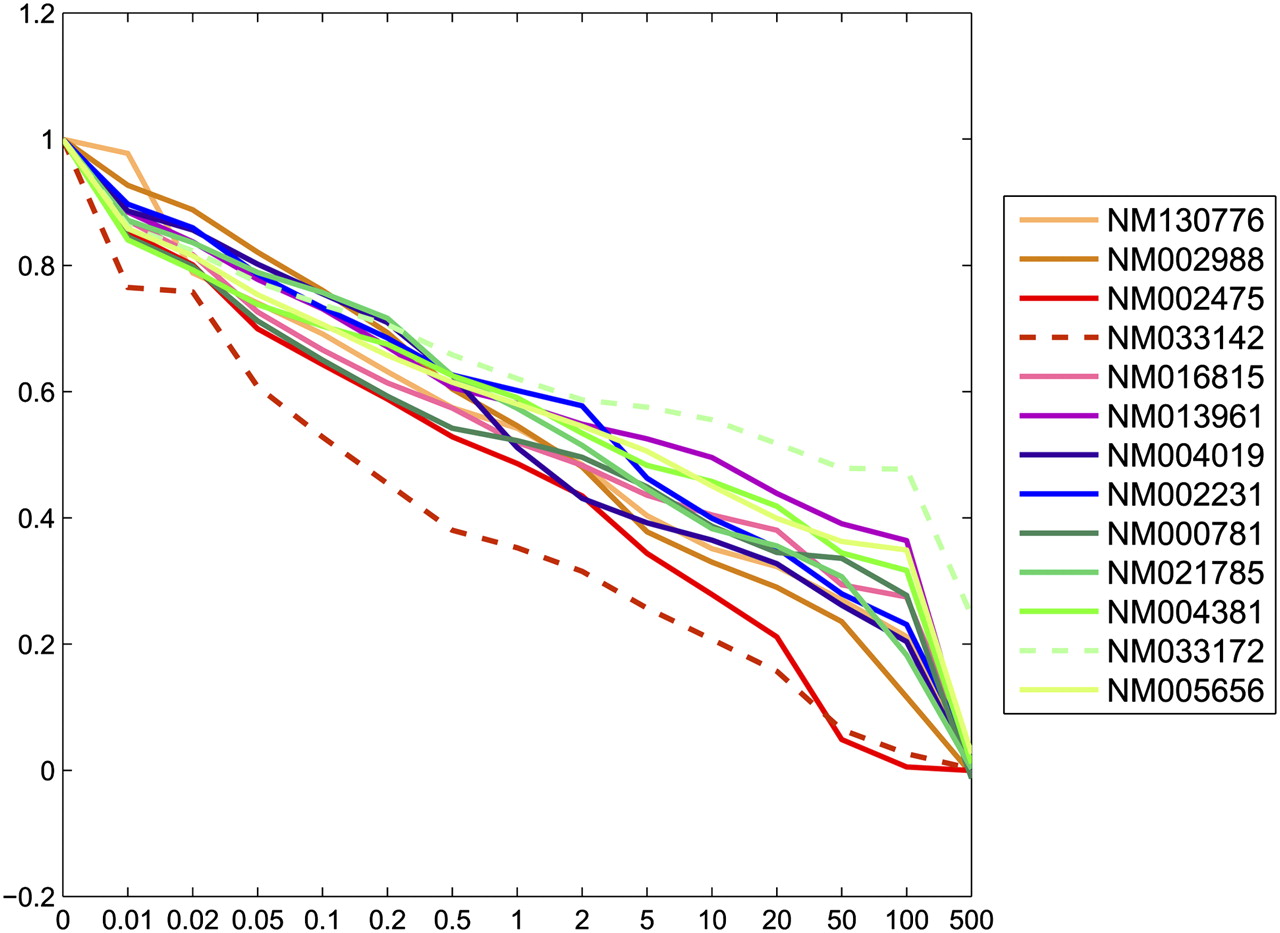
FIGURE 10.
Average Kendall τ ranking scores (vertical axis) for the BP metric versus ρt plotted for different values of t (horizontal axis). The legend lists the sequences in order of length (shortest at the bottom). Dashed lines are used for the average τt scores for NM_033172 (pale green) and NM_033142 (red) because they exhibit, to some extent, the most extreme behavior. The scores were evaluated only for the values of t indicated along the horizontal axis, and straight lines were used to connect successive values of τt. No inference can be made on the behavior of τt between adjacent values of t.




