


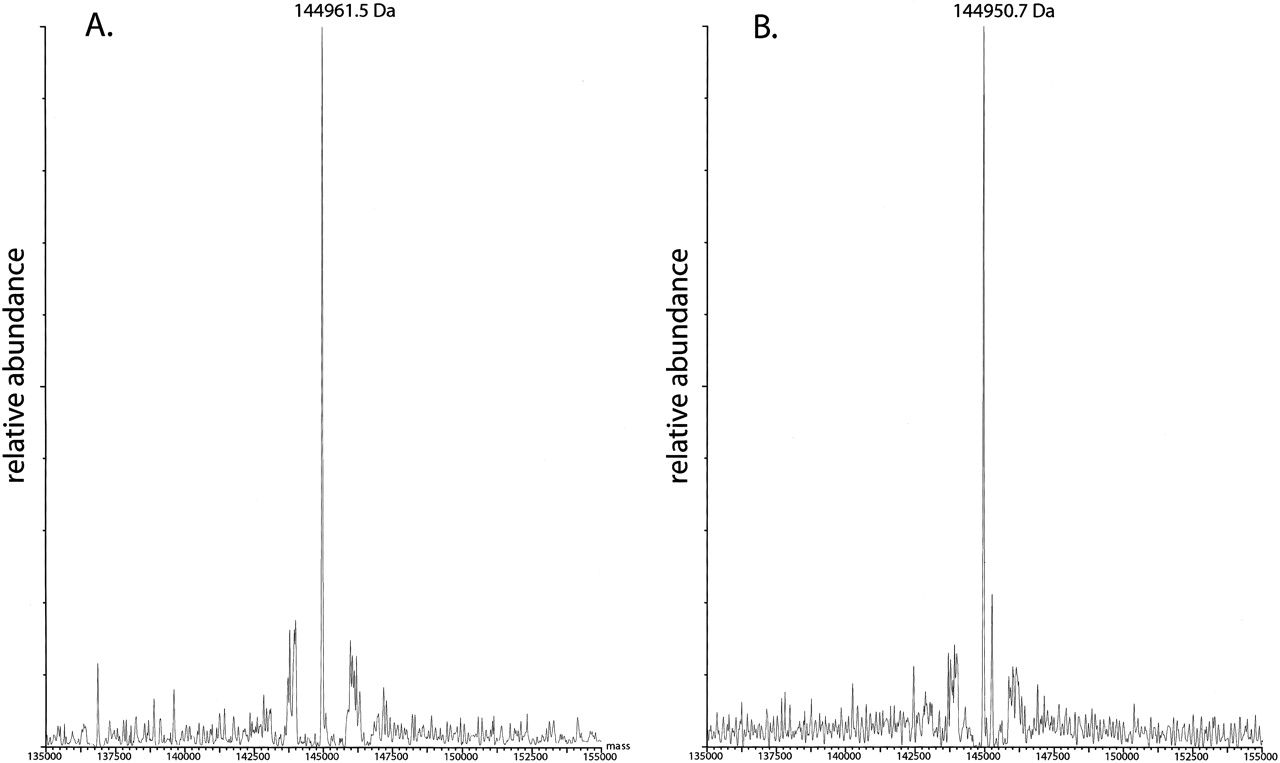
FIGURE 2.
Mass-spectroscopic results. Increased mass is shown on the x axis and abundance of product on the y axis. (A) Molecular mass spectrum of “wild-type” antizyme frameshift cassette product fused between GST and β-gal. (B) Molecular mass spectrum of +1 in-frame control.




