


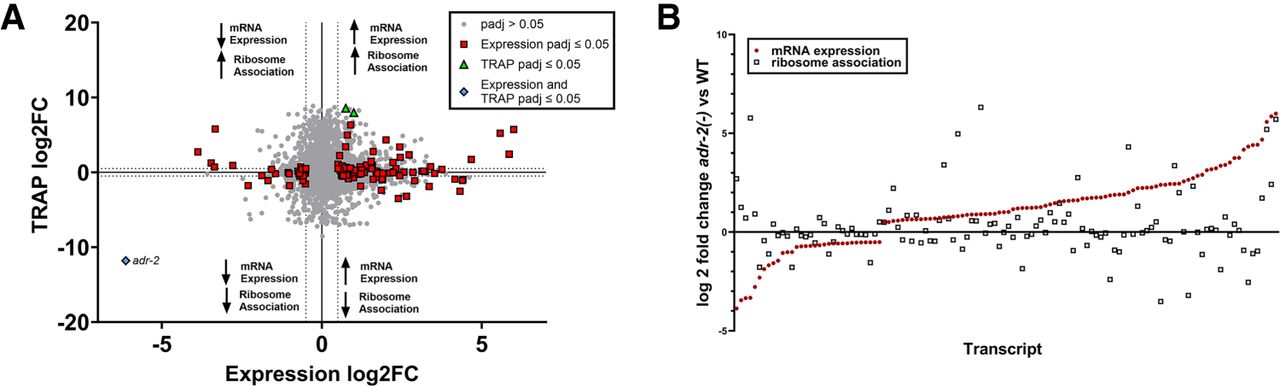
ADR-2-dependent gene expression changes are buffered at the translational level. (A) Quadrant scatter plot showing the fold change (log2) of germline expression (x-axis) and TRAP ribosome association (y-axis) in adr-2(-) germlines compared to wild type. Gray points denote genes with no significant change in either analysis. Red squares indicate a significant change in mRNA expression only (DESeq2 Padj ≤ 0.05, log2 fold change |≥0.5|) in adr-2(-) compared to wild type, and green triangles indicate a significant change in ribosome association only (DESeq2 Padj ≤ 0.05, log2 fold change |≥0.5|) in adr-2(-) compared to wild type. Blue diamond indicates a significant change in both expression and ribosome association (adr-2 only). DESeq2 analyses were performed with three biological replicates. Dotted lines represent log2 fold change significance cutoff. (B) Log2 fold change mRNA expression (red circles) and log2 fold change germline ribosome association (black squares) in adr-2(-) germlines compared to wild type for genes showing significant changes in mRNA expression (DESeq2 Padj ≤ 0.05, log2 fold change |≥0.5|).




