


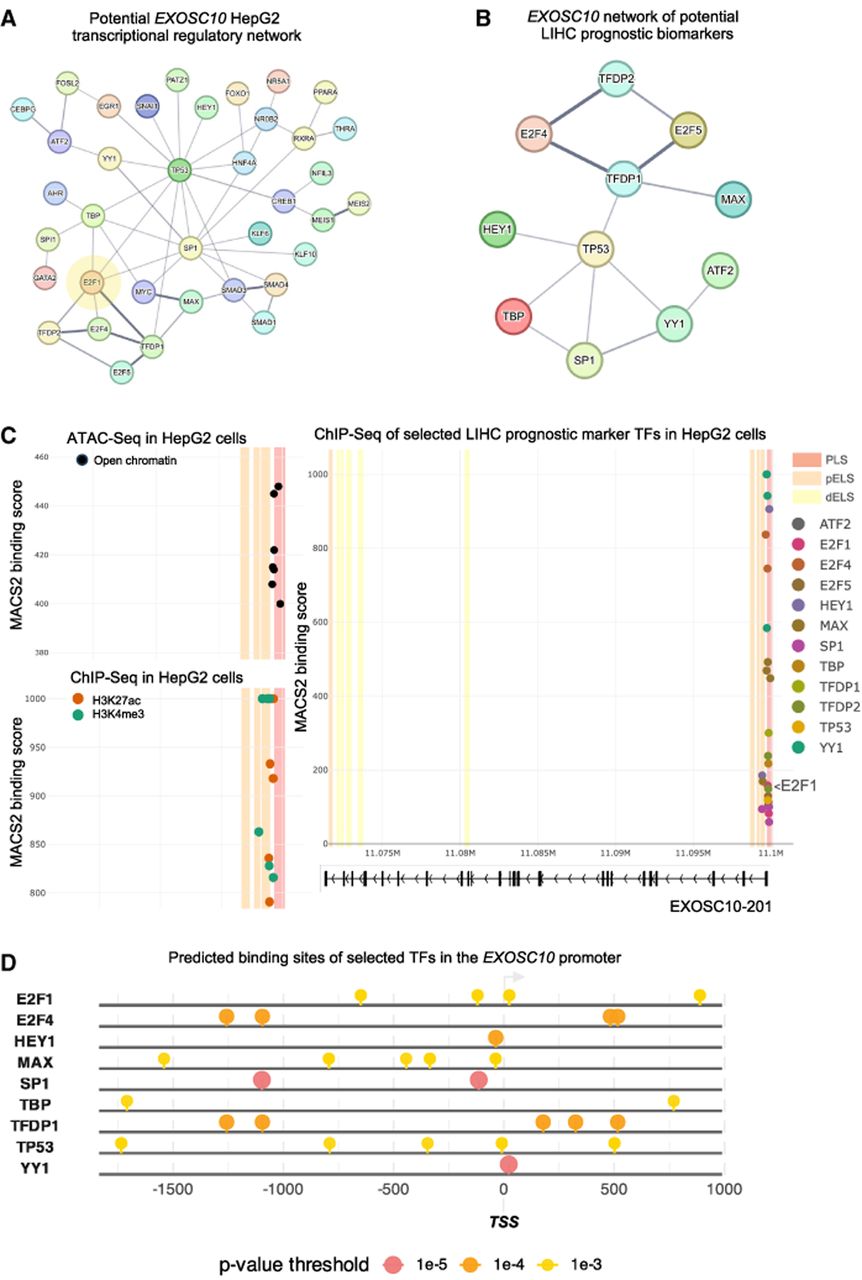
The liver regulatory network binding the EXOSC10 promoter. (A) A physical subnetwork generated using String is shown. Nodes are proteins, and edges represent direct binding. The edge's thickness indicates the level of confidence. E2F1 is highlighted in yellow. (B) A String subnetwork of 11 selected transcription factors (TFs) is shown as indicated at the top. (C) Diagrams generated with HEPATo plot genome annotation coordinates (x-axis) of EXOSC10 (encoding isoform 201) against the MACS2 binding score (−10 × log10 q-value; in the narrowPeak format from 0 to 1000), which is a significance metric that combines the level of enrichment magnitude with the variability of the background (y-axis). The values are not quantitatively comparable across independent SRX studies. We note that HEPATo plots midpoints and not the peak summit. Data from a chromatin accessibility assay (ATAC-seq, black dots) and a genome-wide DNA binding assay for epigenetic marks and transcription factors (ChIP-seq, colored dots) are shown as indicated at the top. E2F1 is included as a reference for promoter binding. Legends define the color code of a promoter-like signature (PLS) and proximal/distal enhancer-like signatures (pELS/dELS) as defined by ENCODE (www.encodeproject.org), two histone markers (red and green), and the color code of dots that represent the MACS2 values attributed to the TFs. (D) A schematic plots the genome coordinates (x-axis, genome assembly Hg38) against the color-coded positions of motifs for selected TFs as indicated (y-axis). The display window was set from −1000 to 100 bp relative to the EXOSC10 TSS, indicated by a light gray arrow. The JASPAR Core 2018 Vertebrates transcription factor motif library was employed for motif prediction in EPD. A legend indicates the color code of P-value thresholds (10−5 in red, 10−4 in orange, and 10−3 in yellow) for predicted motifs. Data exported from EPD and the code are available via the GitHub repository (https://github.com/JulianPrim/HEPATo).




