


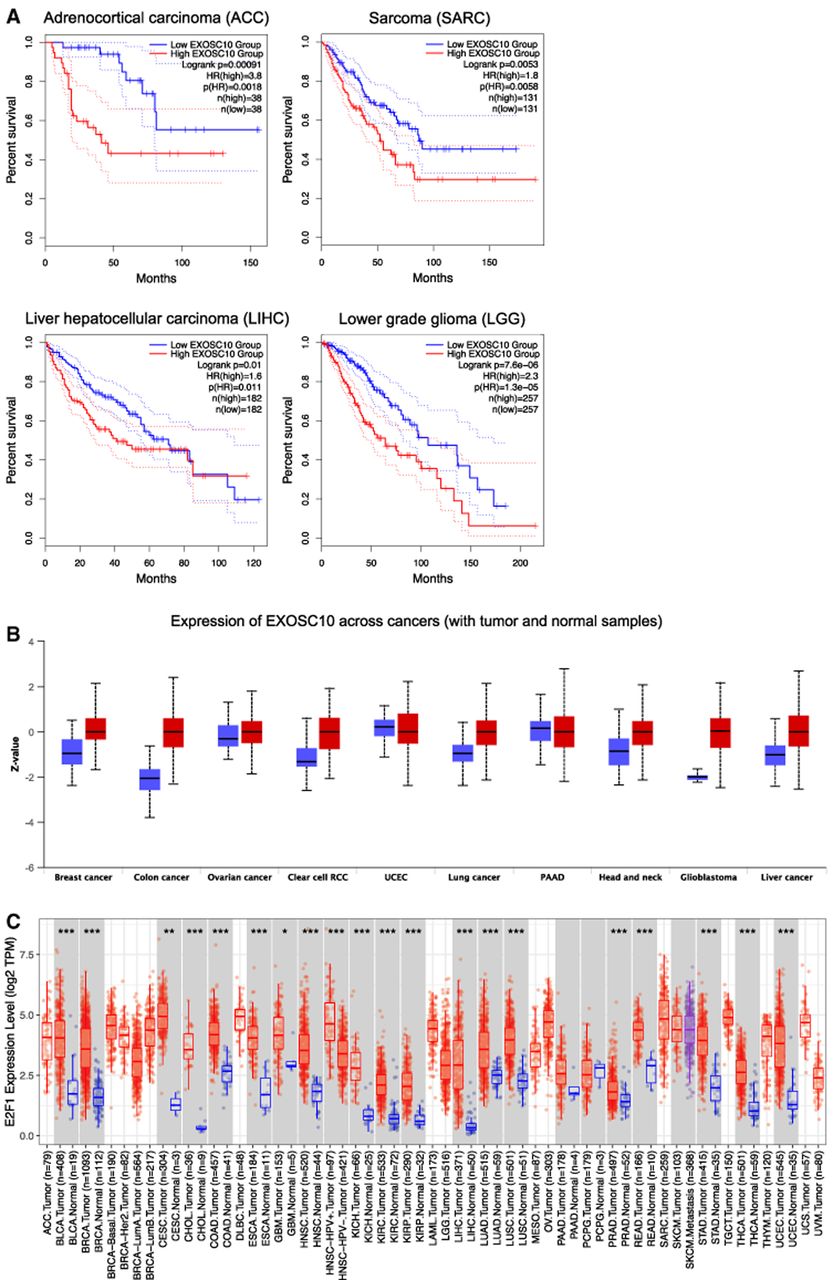
EXOSC10 expression and somatic cancer progression. (A) Color-coded KM plots from the GEPIA 2 database are shown. They illustrate associations that suggest EXOSC10 as a potential negative prognostic cancer biomarker. Legends for high and low expression color codes are shown in the top right corners. The log-rank and hazard score (HZ) P-values are shown, and the sample numbers for high/low expression (n) are given. (B) A whisker graph from UALCAN plots normal (blue) and tumor (red) samples (x-axis) against the Z-score transformed EXOSC10 protein concentration signal values (y-axis). Horizontal bars are the median. Sample annotation is spelled out or shown as clear cell RCC (renal clear cell), UCEC (uterine corpus endometrial carcinoma) and PAAD (pancreatic adenocarcinoma). (C) A whisker graph from TIMER 2 plots normal (blue) and tumor (red) samples (x-axis) against the log2-transformed transcript per million (TPM) signal values for E2F1 (y-axis). Horizontal bars are the median. Asterisks indicate statistically significant differences in expression levels. Sample numbers (n) are indicated. The full names of normal and cancer sample acronyms are shown in Supplemental Figure S1.




