


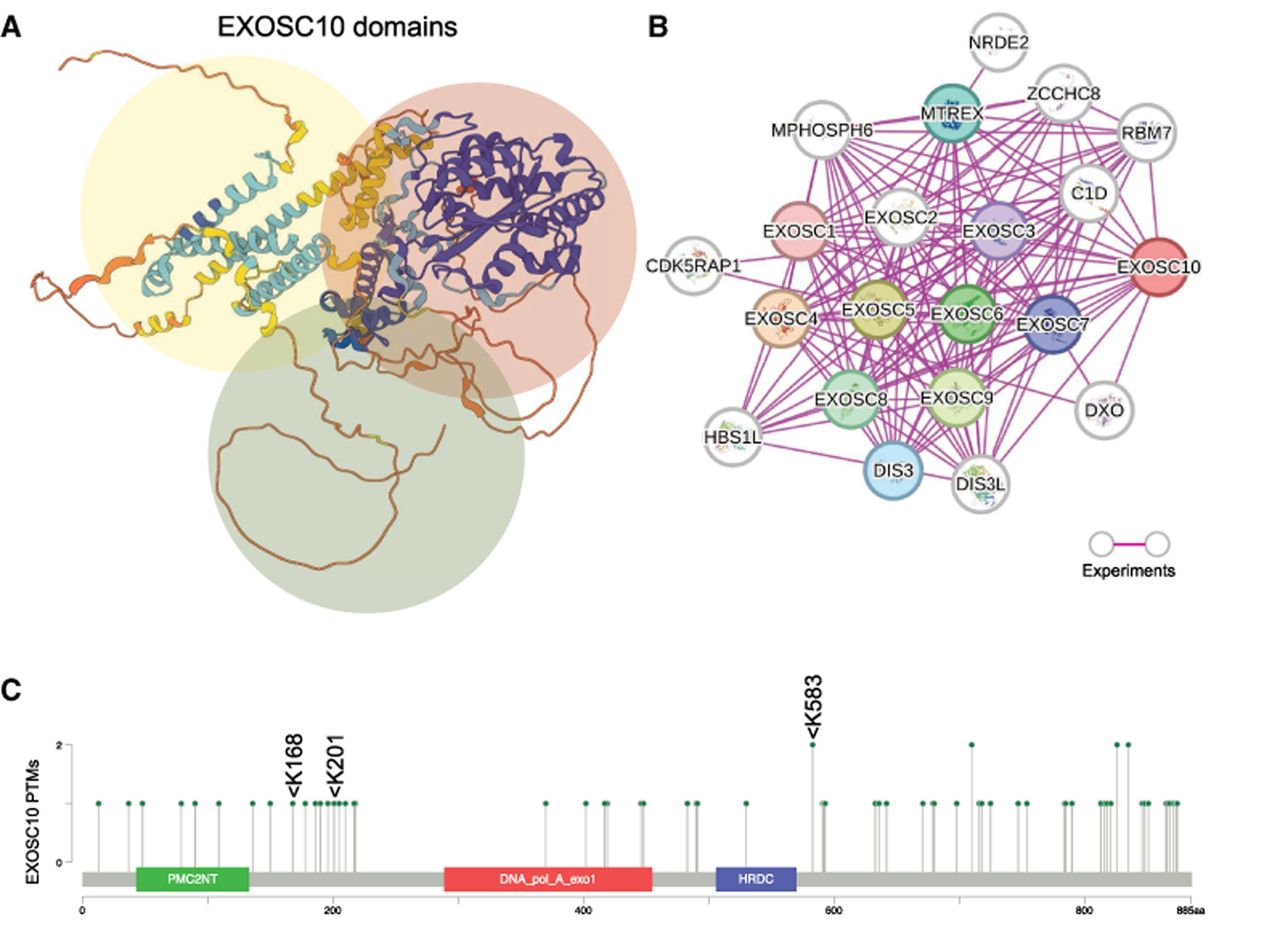
EXOSC10 structure, protein network, and sumoylation. (A) A cartoon structure from the AlphaFold database (https://alphafold.ebi.ac.uk) for human EXOSC10 (AF-Q01780-F1) is shown, and N-terminal, internal, and C-terminal regions are highlighted in yellow, red, and green, respectively. (B) An experimentally verified physical subnetwork of EXOSC10, RNA-exosome core subunits, and cofactors as provided by the String database (https://string-db.org) is shown. (C) A lollipop plot of posttranslational modifications referenced by PhosphoSitePlus (https://www.phosphosite.org) generated with cBioPortal's mutation mapper (https://www.cbioportal.org/mutation_mapper) is shown. The positions of amino acids undergoing PTMs (x-axis) are plotted against the number of PTMs for any given residue (y-axis). Three lysines (K) that are sumoylated in response to stress are indicated. The location of functional domains is indicated by colored bars. Amino acid coordinates are given at the bottom.




