


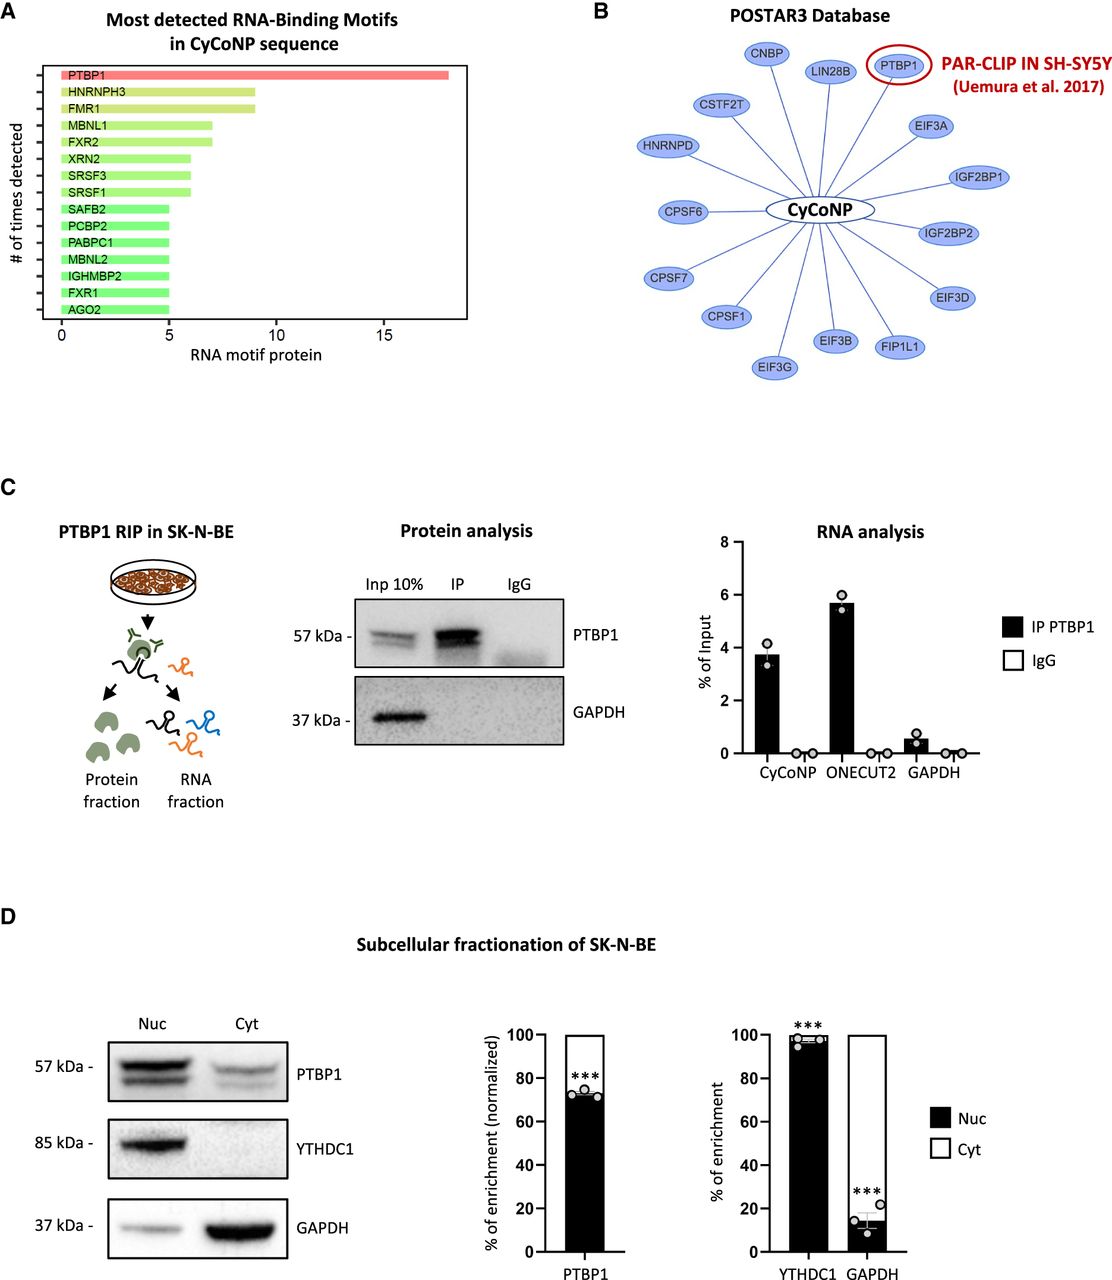
PTBP1 protein and CyCoNP lncRNA interact in the cytoplasm of SK-N-BE cells. (A) catRAPID analysis showing the proteins with detected RNA-binding motifs in CyCoNP transcript sequence among those available in the human proteome. The protein with the highest number of detected RNA-binding motifs, PTBP1, is highlighted in red. (B) Schematic representation of the list of proteins interacting with CyCoNP transcript according to the data retrieved from POSTAR3 database. The only interacting protein detected in a neuroblastoma cell line (SH-SY5Y) is demarcated in red. (C, left) Schematic representation of PTBP1 RNA immunoprecipitation (RIP) assay workflow in SK-N-BE cells (D 1.5). (Middle) Representative western blot analysis of the retrieved protein fractions in PTBP1 IP and IgG samples. GAPDH protein serves as a loading control. Input (Inp) samples represent 10% of the total protein extracts. (Right) RT-qPCR quantification of CyCoNP transcript recovery in PTBP1 IP and IgG samples. ONECUT2 transcript serves as positive control, while GAPDH transcript serves as a negative one. Values represent means ± SD of two biological replicates and are expressed as percentage (%) of input. (D, left) Representative western blot analysis of the nuclear and cytoplasmic fractions of PTBP1, YTHDC1 (nuclear control), and GAPDH (cytoplasmic control) in SK-N-BE cells (D 1.5). Quantification of PTBP1 (middle), YTHDC1, and GAPDH (right) signal intensities in each subcellular compartment. PTBP1 quantification was normalized over the enrichment of GAPDH in the cytoplasmic fraction. Data represent mean ± SEM of three biological replicates. Data information: (***) P < 0.001, unpaired Student's t-test.




