


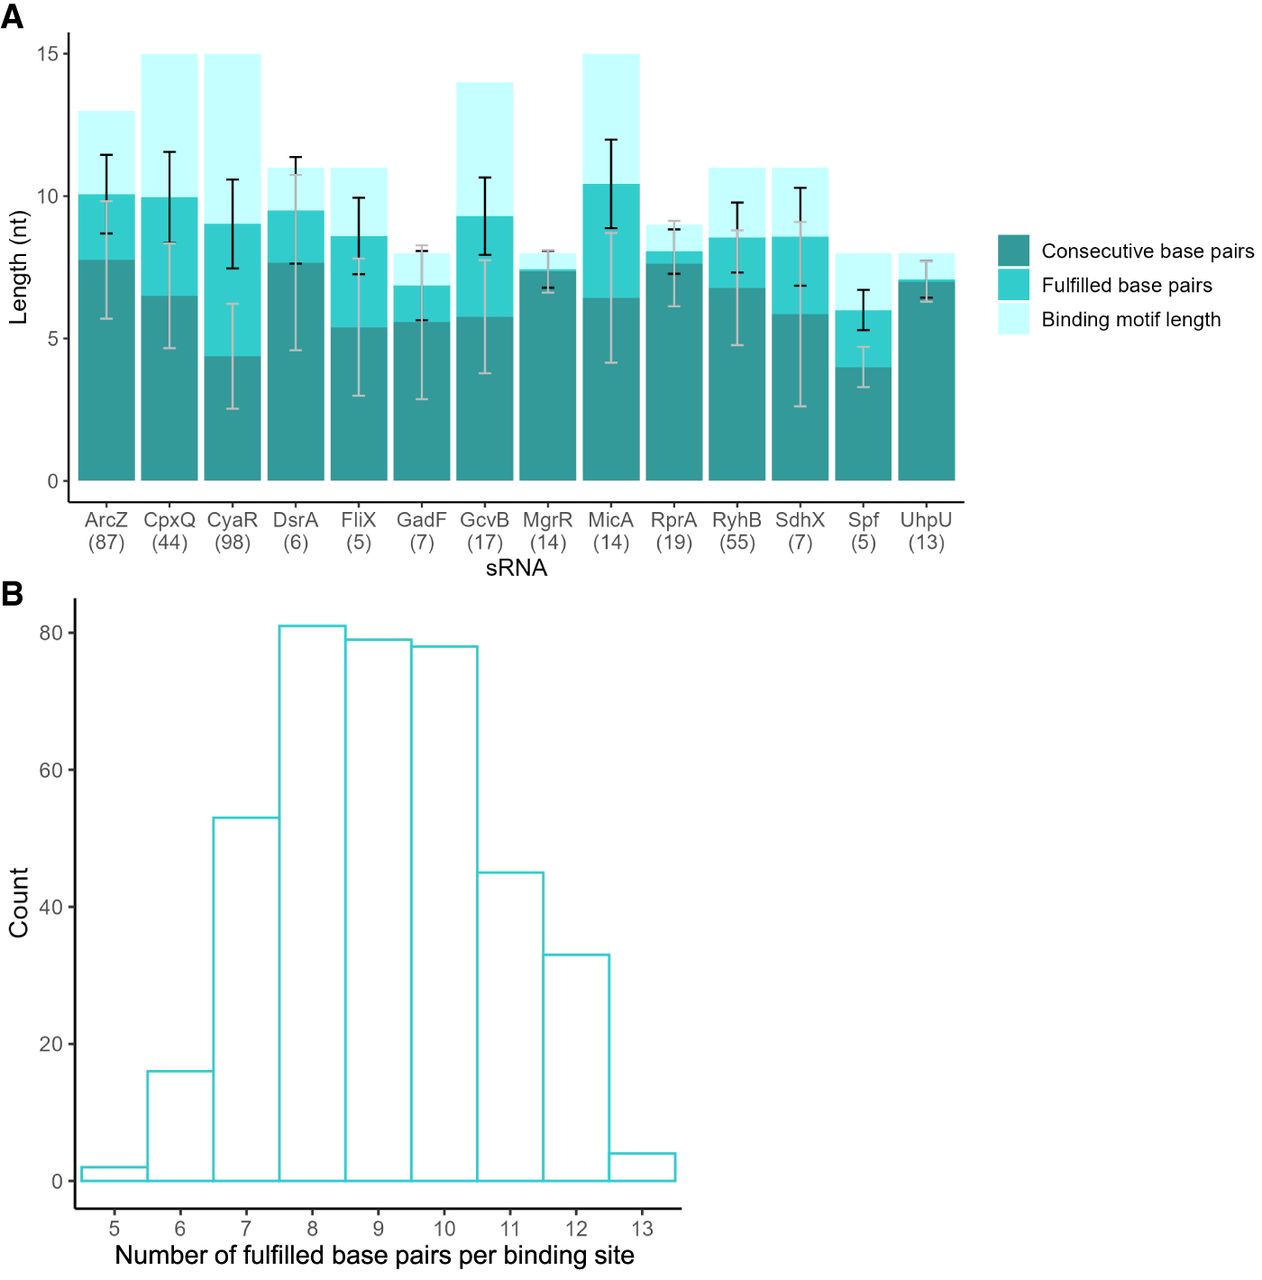
Number of positions fulfilling sRNA–target base-pairing interactions. (A) Bars represent the motif length for each sRNA (light green), the number of fulfilled base pairs (darker green), and the number of consecutive fulfilled base pairs (darkest green). Number in parentheses indicates the number of targets of each sRNA in the data (sRNAs with at least five targets were included in this analysis). Black lines and gray lines indicate the standard deviations of the number of fulfilled base pairs and consecutive base pairs, respectively. (B) Number of fulfilled base-pairing interactions per binding site across all studied sRNAs. The y-axis shows the number of sRNA–target pairs that fulfilled a particular number of base pairs.




