


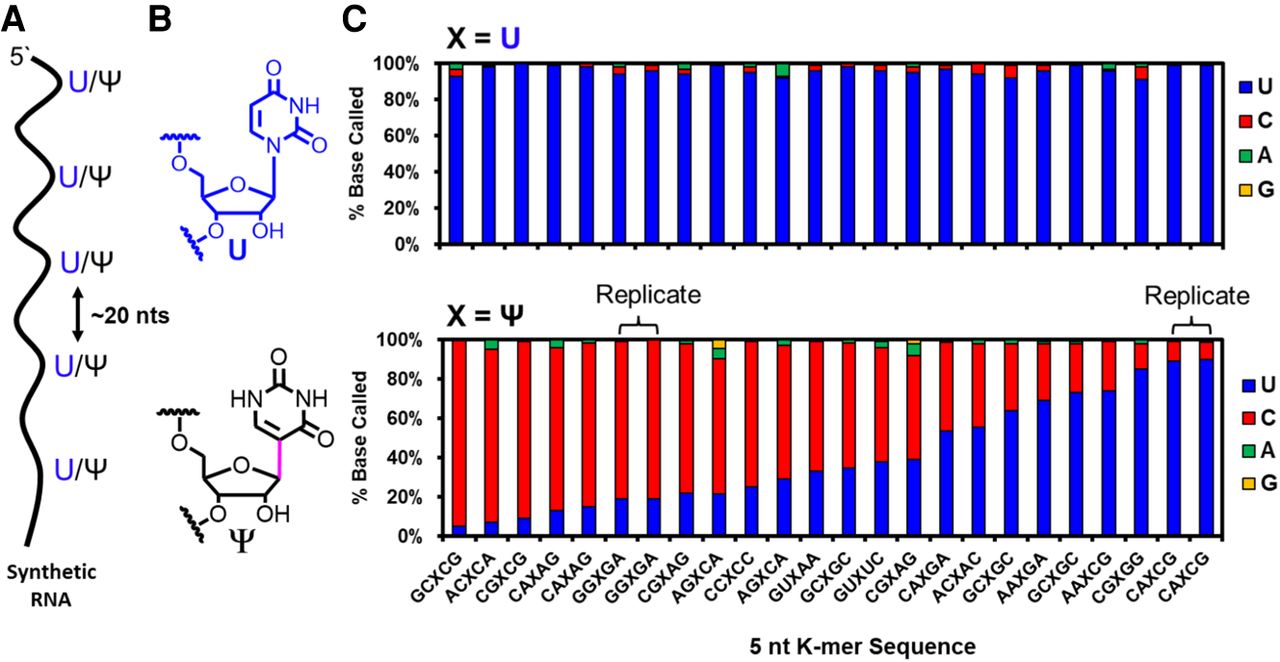
FIGURE 2.
Range of base miscalls for Ψ embedded in synthetic RNA at 100% frequency. (A) Layout of the synthetic RNA to study base calling for U versus Ψ present at 100% occupancy and positioned >20 nt apart to ensure only one modification at a time influences the signal. (B) The structures for U and Ψ isomers. (C, top) Bar chart of base calls for U in 22 different 5 nt k-mers and (bottom) base calls for Ψ in the same k-mers. Two replicates are provided to demonstrate reproducibility in the base call data. These data were obtained using Guppy v.3 and aligning to the reference with minimap2. The figure and data are reconstructed from our prior report (Fleming et al. 2021).




