


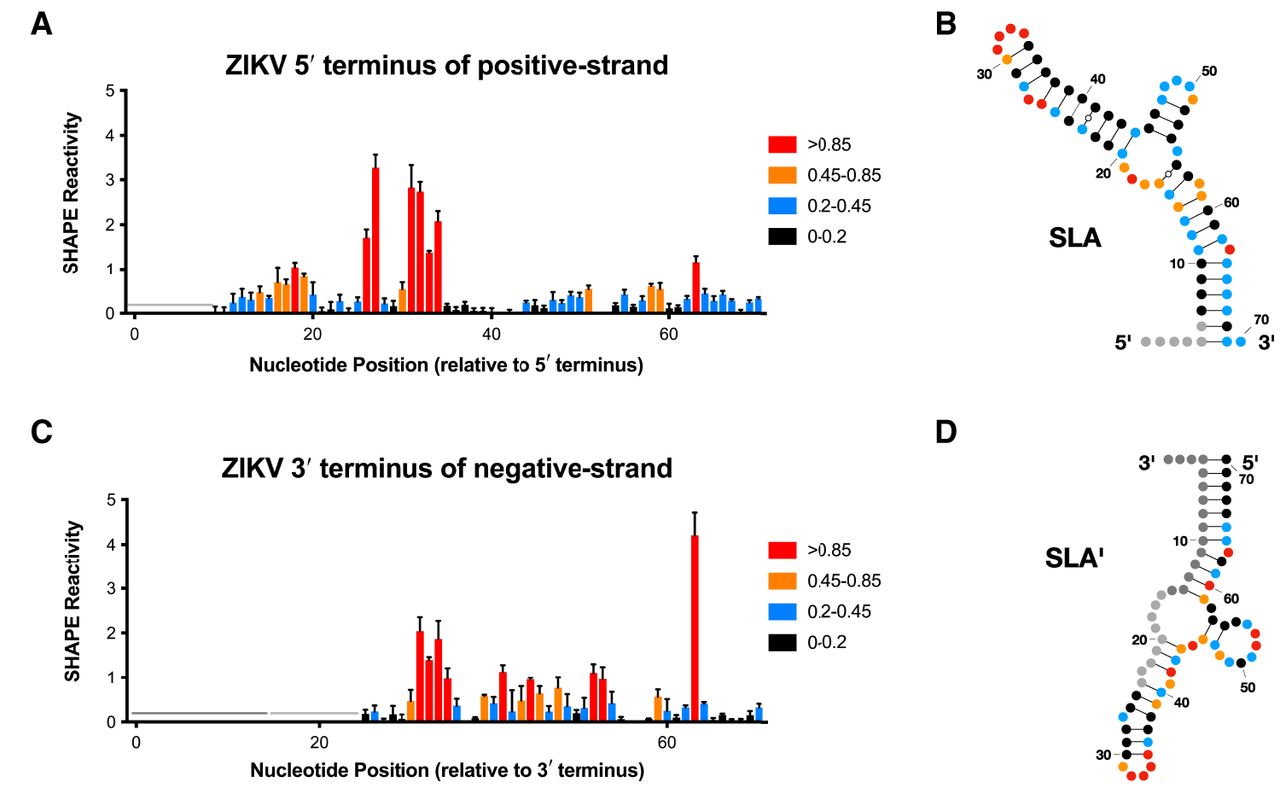
In vitro selective 2′ hydroxyl acylation analyzed by primer extension (SHAPE) analysis of the 3′ terminus of the negative strand in Zika virus (ZIKV) is consistent with SLA′ formation. (A) Normalized SHAPE reactivities of the first 70 nt at the 5′ terminus of the positive strand of ZIKV. Data are shown as the normalized SHAPE reactivity from four biological replicates, and error bars represent the SEM. Nucleotides with very low (≤0.2), low (0.2–0.4, blue), intermediate (0.4–0.85, orange), and high (≥0.85, red) SHAPE reactivity are indicated. Nucleotides 1–6 were omitted due to high background reactivity (light gray). (B) Prediction of the lowest free energy structure formed by the first 70 nt of the ZIKV positive strand as constrained by the normalized SHAPE reactivity data from (A). Tick marks represent 10 nt intervals. (C) Normalized SHAPE reactivities of the last 70 nt at the 3′ terminus of the negative strand of ZIKV. Data are shown as the normalized SHAPE reactivity from four biological replicates, and error bars represent the SEM. Nucleotides 1–15 were bound by the primer (dark gray), and nucleotides 16–23 and 157–163 were omitted due to high background reactivity (light gray). (D) Prediction of the lowest free energy structure formed by the last 70 nt of the ZIKV negative strand as constrained by the normalized SHAPE reactivity data from (C).




