


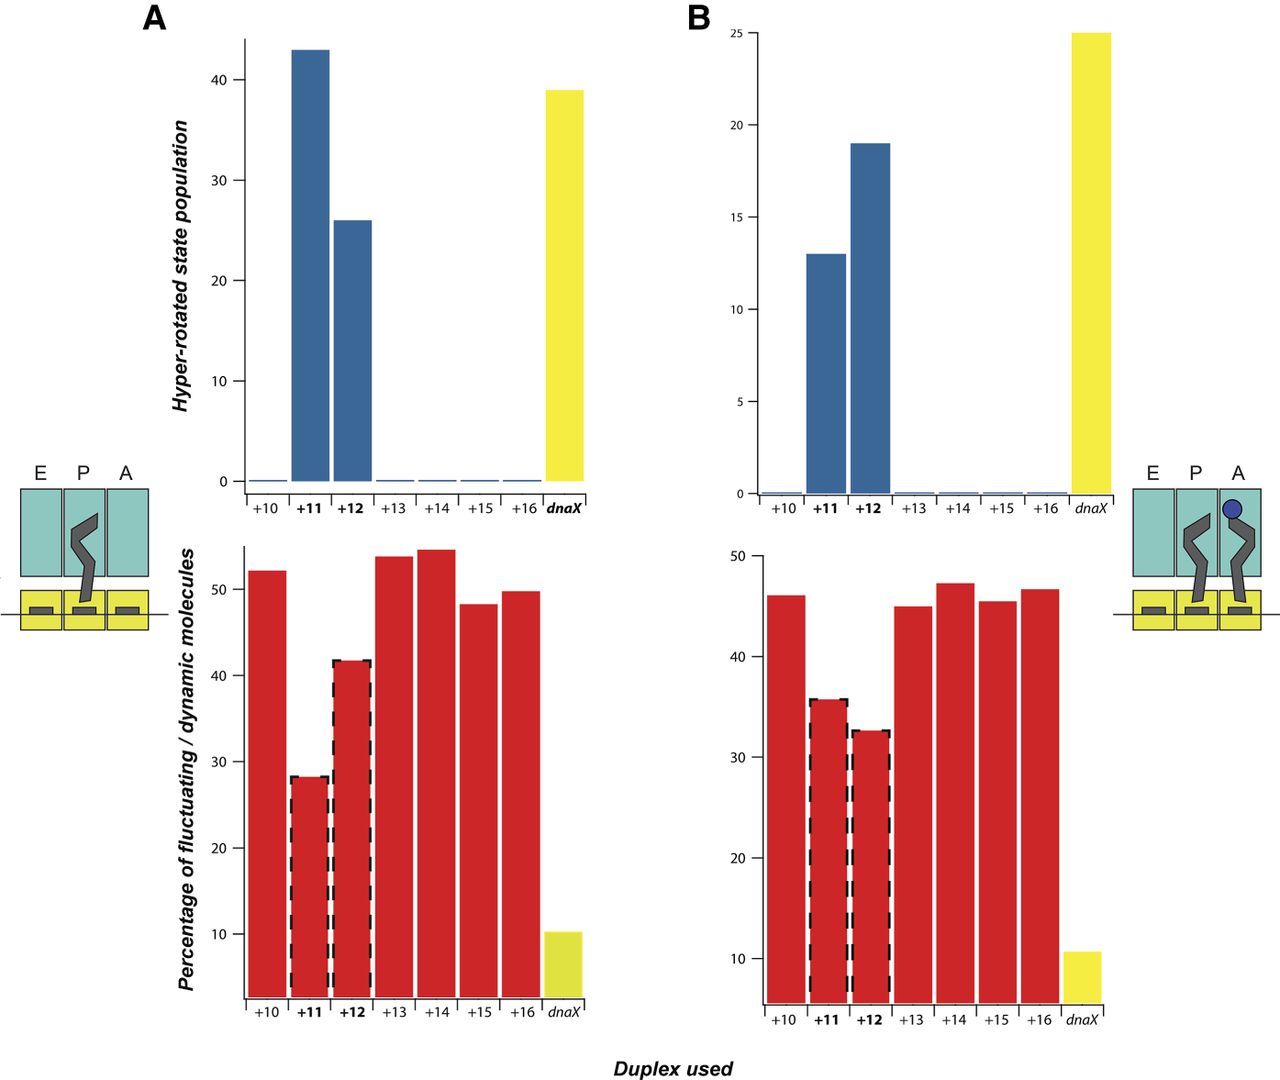
FIGURE 5.
The negative correlation between the prevalence of the hyperrotated population and the percentage of dynamic molecules. (A) The left panel shows data from the singly occupied P site. (B) The right panel shows data for a pretranslocation complex. Red bars represent the percentage of fluctuating molecules. Blue bars represent the population of the hyperrotated state. Highlighted data: dnaX is bolded and shown in yellow; +11 and +12 are bolded and highlighted with a dotted margin.




