


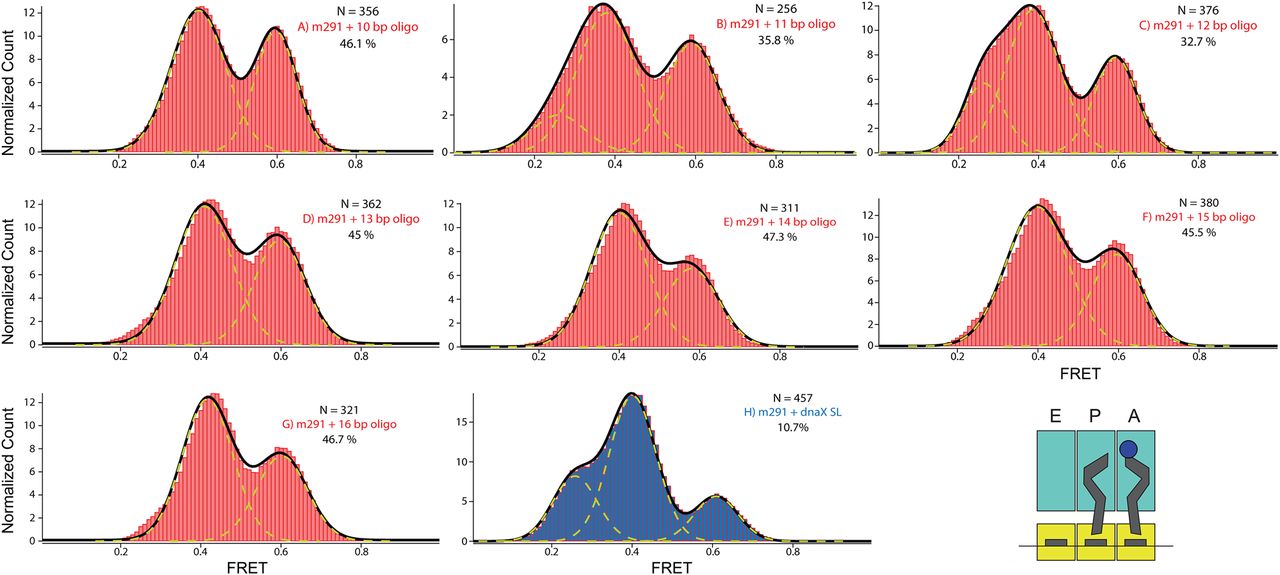
FIGURE 4.
Normalized histograms compiled from hundreds of traces showing distributions of Förster resonance energy transfer (FRET) values for S6-Cy5/L9-Cy3 ribosomes containing a deacylated tRNAfMet in the P site, N-Ac-Phe-tRNAPhe in the A site, and nucleic acid duplexes. N, number of molecules used to compile each histogram; yellow lines represent individual Gaussian fits centered at ∼0.26 (hyperrotated state), 0.38 (rotated state), and 0.58 (nonrotated state) FRET efficiency; black lines represent the sum of two (A, D–G) or three (B, C, H) Gaussians; % represents the percentage of fluctuating molecules for a given ribosomal complex.




