


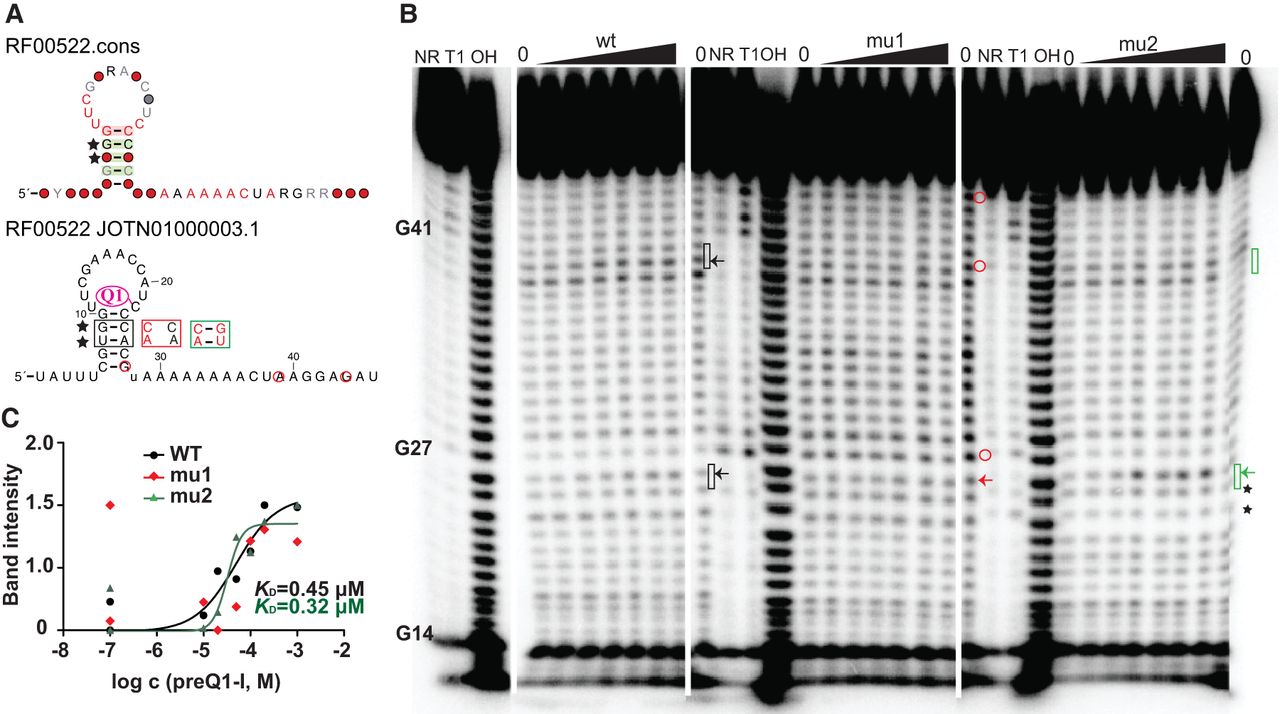
PreQ1-I riboswitch. (A, top) The consensus structure of preQ1-I riboswitch. (A, bottom) The secondary structure of the sequence from Bacillus manliponensis, which was used for in-line probing. Q1 refers to preQ1 molecule. (B) In-line probing gel patterns from the three different constructs of preQ1-I and the modulation changes in the presence of preQ1. The different colored rectangles indicate preQ1-induced modulation. The different colored circles indicate structural changes in the disrupted mutant. The arrows mark the positions used to calculate the KD in C. (C) Plot of the fraction of RNAs whose cleavage sites (marked in B with arrows) are modulated with increasing concentrations of preQ1. No curve could be inferred for mu1 KD calculation, as would be expected if preQ1 binding is abolished. Other legend details are as in Figure 3. We repeated the in-line probing assay with similar results (Supplemental Fig. S2). Note that the first concentration of preQ1 tested is not 10−7 as indicated, but rather 0, and this allows us to plot these data points on a log scale (note that we test two “0” for each RNA).




