


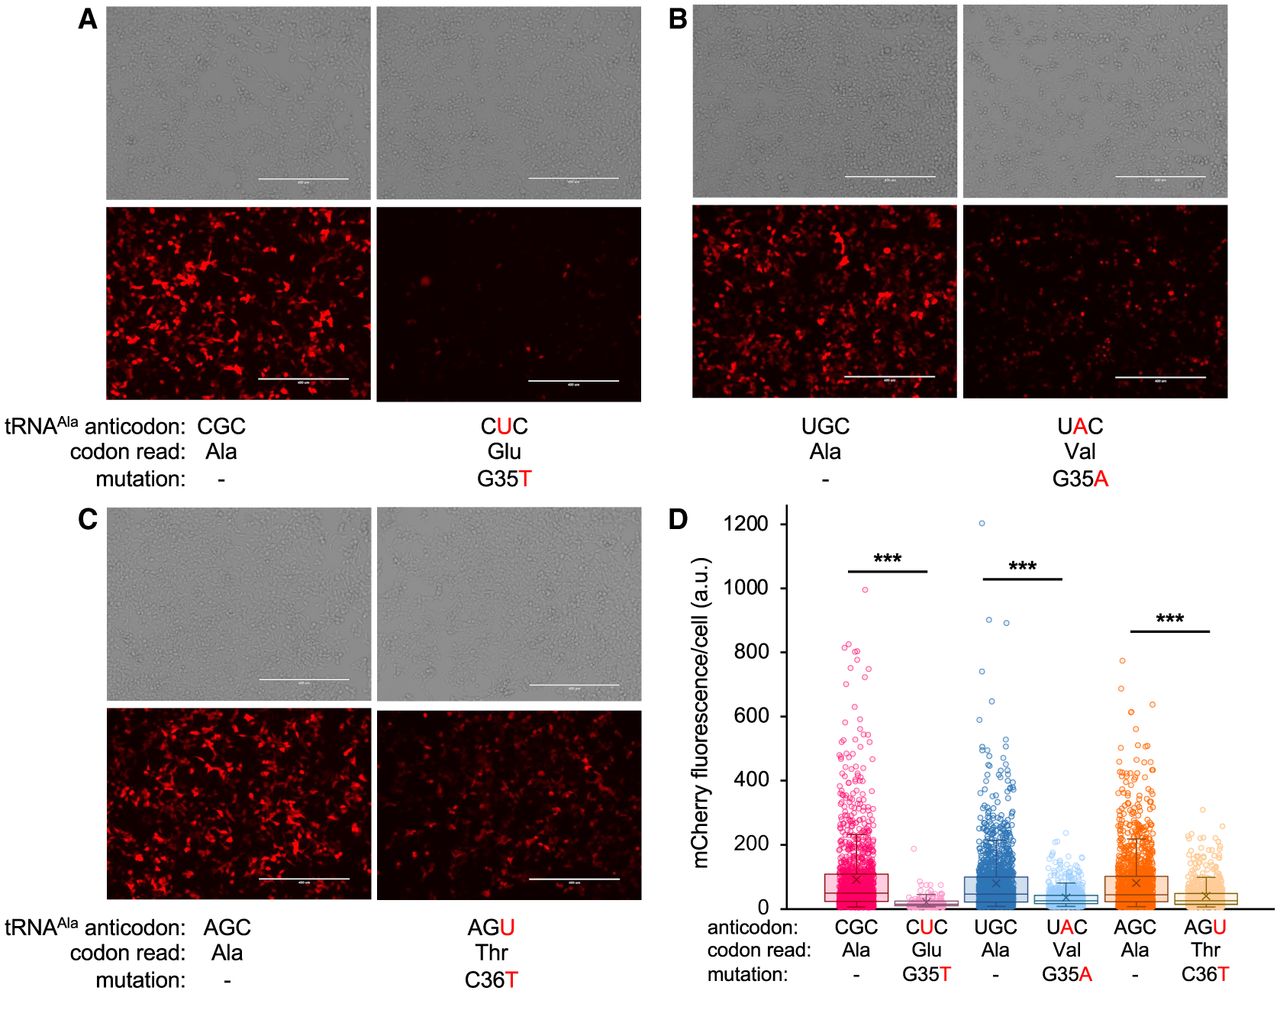
FIGURE 3.
mCherry fluorescence in normal and mistranslating cells. (A–C) Brightfield (above) and fluorescent images (below) showing mCherry production in cells coexpressing wild-type or the indicated (A) Glu-decoding, (B) Val-decoding, or (C) Thr-decoding tRNAAla variants. Scale bars, 400 μm. (D) Box and whisker plot and quantitation of mean mCherry fluorescence in individual cells. Independent sample t-tests were computed (*** P < 0.001) based on at least n = 3 biological replicates. We imaged 1500–1700 individual cells in each biological replicate.




