


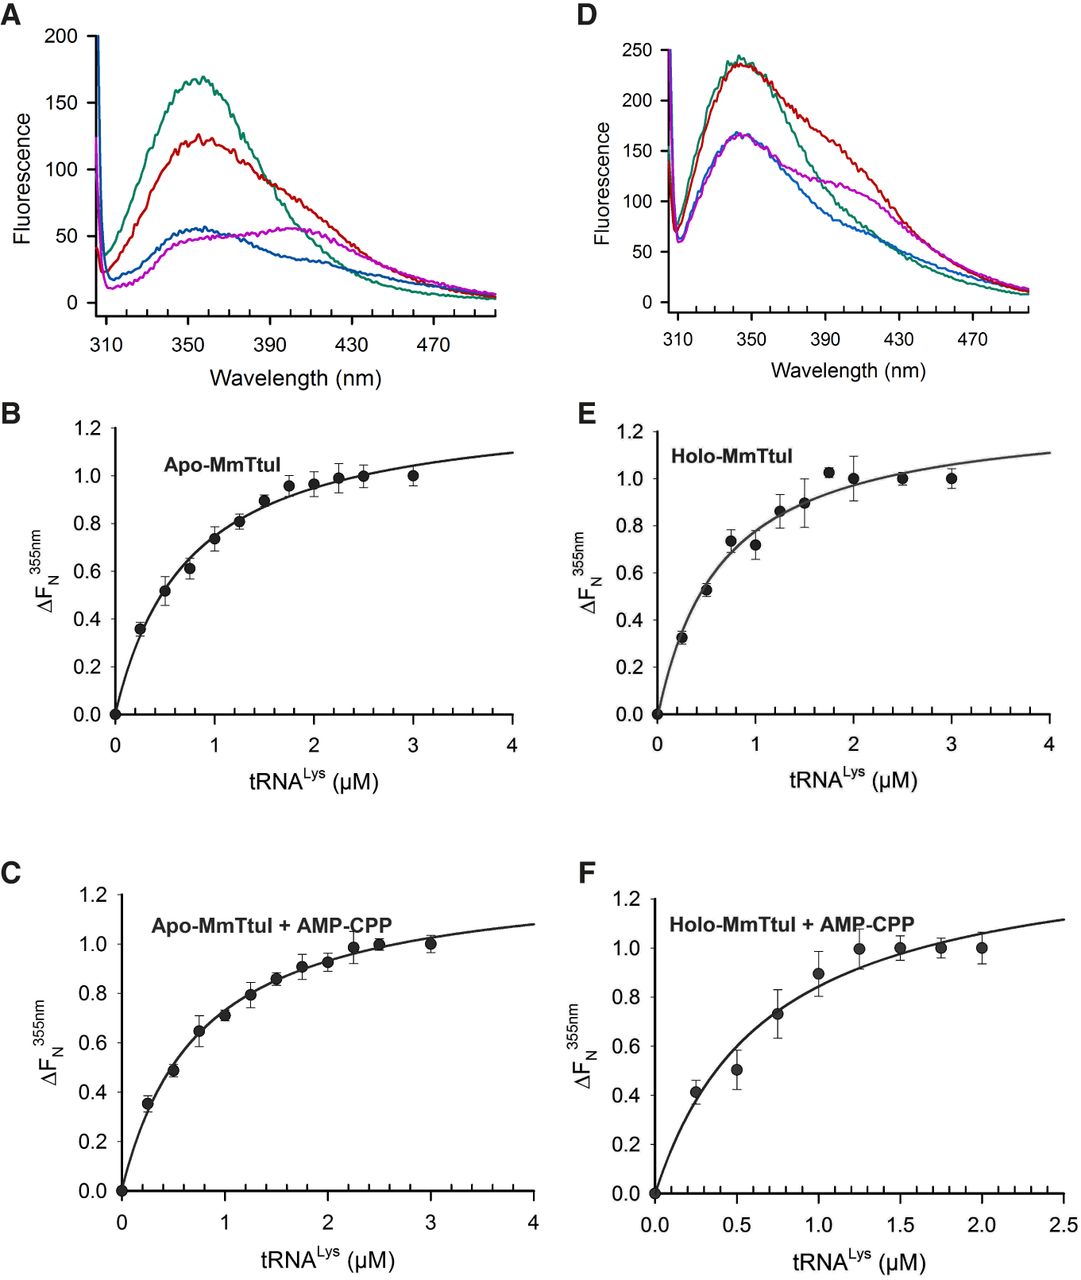
Monitoring of MmtRNALys binding to apo- and holo-MmTtuI by fluorescence. (A) Fluorescence spectra obtained at λex = 295 nm of apo-MmTtuI (0.5 µM) alone (in green), apo-MmTtuI + 3 mM AMP-CPP (in red), apo-MmTtuI + 2 µM tRNALys (in blue), and apo-MmTtuI + 3 mM AMP-CPP + 2 µM tRNALys (in magenta). (B) and (C) Saturation curves of W282 fluorescence at 355 nm normalized to tRNALys concentration for apo-MmTtuI in the absence (B) and presence of 3 mM AMP-CPP (C). (D) Fluorescence spectra obtained at λex = 295 nm of holo-MmTtuI (0.5 µM) alone (in green), holo-MmTtuI + 3 mM AMP-CPP (in red), holo-MmTtuI + 2 µM tRNALys (in blue), holo-MmTtuI + 3 mM AMP-CPP + 2 µM tRNALys (in magenta). (E) and (F) Normalized saturation curves of fluorescence at 355 nm, for holo-MmTtuI in the absence (E) and presence of 3 mM AMP-CPP (F).




