


Prevention of ribozyme catalysis through cDNA synthesis enables accurate RT-qPCR measurements of context-dependent ribozyme activity
- Corresponding author: samuel.schaffter{at}nist.gov
-
Handling editor: Adrian Ferre-D'Amare
Abstract
Self-cleaving ribozymes are important tools in synthetic biology, biomanufacturing, and nucleic acid therapeutics. These broad applications deploy ribozymes in many genetic and environmental contexts, which can influence activity. Thus, accurate measurements of ribozyme activity across diverse contexts are crucial for validating new ribozyme sequences and ribozyme-based biotechnologies. Ribozyme activity measurements that rely on RNA extraction, such as RNA sequencing or reverse transcription-quantitative polymerase chain reaction (RT-qPCR), are generalizable to most applications and have high sensitivity. However, the activity measurement is indirect, taking place after RNA is isolated from the environment of interest and copied to DNA. Thus, these measurements may not accurately reflect the activity in the original context. Here, we develop and validate an RT-qPCR method for measuring context-dependent ribozyme activity using a set of self-cleaving RNAs for which context-dependent ribozyme cleavage is known in vitro. We find that RNA extraction and reverse transcription conditions can induce substantial ribozyme cleavage, resulting in incorrect activity measurements with RT-qPCR. To restore the accuracy of the RT-qPCR measurements, we introduce an oligonucleotide into the sample preparation workflow that inhibits ribozyme activity. We then apply our method to measure ribozyme cleavage of RNAs produced in Escherichia coli. These results have broad implications for many ribozyme measurements and technologies.
Keywords
INTRODUCTION
Self-cleaving ribozymes are ubiquitous throughout the tree of life (Webb et al. 2009; Weinberg et al. 2019) and play crucial roles in viral replication and regulation of gene expression (Jimenez et al. 2015; Weinberg 2021). Ribozymes are also commonly repurposed for applications in synthetic biology (Lou et al. 2012; Park et al. 2019; Dykstra et al. 2022), biomanufacturing (Schürer et al. 2002; Chen et al. 2022; Ryczek et al. 2022), and nucleic acid therapeutics (Feng et al. 2021; Zhu et al. 2022). For example, self-cleaving ribozymes have been used to produce RNA transcripts of uniform length (Schürer et al. 2002; Chen et al. 2022), build biosensors that control gene expression (Dykstra et al. 2022), insulate gene expression levels from upstream sequences in genetic circuits (Lou et al. 2012), and produce multistranded RNA components that fold cotranscriptionally (Bae et al. 2021; Schaffter and Strychalski 2022; Schaffter et al. 2023). These applications span in vitro transcription (IVT), cell-free lysates, and prokaryotic and eukaryotic cells, with each environment presenting unique conditions that could influence ribozyme activity (Kato et al. 2001; Yamagami et al. 2018, 2021; Sieg et al. 2022). Further, ribozymes are often used in many different genetic contexts, i.e., with different sequences flanking the ribozyme, and each new context has the potential to introduce alternative folds that change activity (Chadalavada et al. 2000; Diegelman-Parente and Bevilacqua 2002; Brown et al. 2008; Wang et al. 2018; Wurmthaler et al. 2018; McKinley et al. 2023). Together, these differences in ribozyme activity across genetic and environmental contexts represent context-dependent effects (Fig. 1A) that need to be measured when developing new ribozyme-based technologies or discovering new ribozyme sequences.
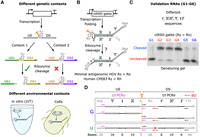
Overview of context-dependent ribozyme cleavage and RT-qPCR measurements. (A) Context-dependent ribozyme (Rz) cleavage. (Top) Different genetic contexts, i.e., upstream (US) or downstream (DS) sequences, can inhibit ribozyme cleavage. Orange scissors indicate the intended ribozyme cleavage site. (Bottom) Ribozyme activity can vary in different environments, such as in vitro (IVT) and in cells. (B) Schematic of cotranscriptionally encoded RNA strand displacement (ctRSD) gates. Domains Y, j, X, and domains i′, X′, j′ represent different upstream and downstream sequences, respectively. (C) Denaturing gel electrophoresis results of ctRSD gate sequences selected to validate the RT-qPCR method. G1–G6 have different sequences upstream and/or downstream of a minimal version of the antigenomic HDV ribozyme (Schürer et al. 2002), termed Ro. See Supplemental Section 1 for gate schematics and sequences. The gel was prestained with SYBR Gold. (D) Schematic of primer layout to measure ribozyme cleavage with RT-qPCR. The PCRu primers (pink) span the cleavage site (orange dashed line) and should only amplify uncleaved products. The PCRo primers amplify both cleaved and uncleaved products to amplify total RNA. U is a reference RNA that contains a single base mutation (maroon X) compared to G, which abolishes ribozyme activity. The difference in PCRu Ct between G and U transcripts, corrected for total RNA differences by PCRo, yields a measure of ribozyme cleavage (Materials and Methods). BO represents a blocking oligonucleotide (BO) that is added to prevent ribozyme cleavage during sample preparation (Materials and Methods). The red circle at the left end of BO indicates a 3′ amino modification to prevent extension during RT-qPCR. The numbers below the box indicate the length of each domain in bases.
Many methods for measuring self-cleaving ribozyme activity exist, such as electrophoretic separation (Donahue and Fedor 1997; Koseki et al. 1999; Zingler 2014; Filonov et al. 2015), Förster resonance energy transfer (FRET) (Singh et al. 1999; Zhuang et al. 2000; Andreasson et al. 2020), connecting ribozyme activity to the expression of a reporter gene (Donahue and Fedor 1997; Ogawa and Maeda 2007; Wieland and Hartig 2008; Nomura et al. 2013; Townshend et al. 2015; Xiang et al. 2019; Aroonsri et al. 2021), RNA sequencing (RNA-seq) (Kobori et al. 2015; Peach et al. 2015; Xiang et al. 2019; Espah Borujeni et al. 2020; Yokobayashi 2020; Olzog et al. 2021; Roberts et al. 2023), and reverse-transcription-polymerase chain reaction (RT-PCR)-based techniques (Lou et al. 2012; Roth et al. 2014; Kim et al. 2018; Vlková et al. 2021). Gel electrophoresis and FRET are well suited for IVT studies, but these techniques can be difficult for RNA produced in cells; particularly for RNAs with low expression, for which signal may be below the detection limit (He and Green 2013). Connecting ribozyme activity to the expression of a reporter gene is ideal for in situ measurements in cells but can be difficult to generalize across cell lines, typically requiring different implementations for prokaryotic (Ogawa and Maeda 2007; Wieland and Hartig 2008; Aroonsri et al. 2021) and eukaryotic systems (Nomura et al. 2013; Townshend et al. 2015; Xiang et al. 2019). These methods are also not applicable outside of cells as they rely on cellular machinery not usually present in many cell-free systems. RNA-seq and reverse transcription-quantitative polymerase chain reaction (RT-qPCR) methods have high sensitivities and are applicable to any environment because RNA is extracted prior to measurement, making these techniques ideal for evaluation of broad, context-dependent effects on ribozyme activity.
When considering RNA-seq and RT-qPCR, the choice of method often comes down to the necessary measurement scale. RNA-seq is often used for high-throughput measurements, such as screening large libraries of candidate ribozyme sequences or genetic contexts, as sequencing allows for a single multiplexed measurement of the entire library (Kobori et al. 2015; Peach et al. 2015; Xiang et al. 2019; Yokobayashi 2020; Olzog et al. 2021; Roberts et al. 2023). RT-qPCR often makes sense for measuring a small set of sequences, e.g., <20, as it is less costly than sequencing, requires less sample preparation, and can be performed and analyzed quickly (Kim et al. 2018; Vlková et al. 2021). For both RNA-seq and RT-qPCR, RNA must be extracted from the environment in which it was produced and then reverse transcribed before a measurement takes place. These unavoidable manipulations could perturb RNA structure, potentially influencing the final ribozyme activity measurement. This is especially important when measuring context-dependent ribozyme cleavage, as RNAs that do not cleave in the context of interest may be metastable and cleave during sample preparation. For example, reverse transcription is usually performed at 40°C–60°C to reduce RNA secondary structure, but these elevated temperatures could induce unwanted ribozyme activity in RNAs that were not active when transcribed at biological temperatures of 25°C–37°C. Further, RNA extraction and reverse transcription buffers have different ion compositions compared to the environments the RNAs were produced in, which could alter secondary structure and catalytic activity (Yamagami et al. 2018). So, indirect measurements of ribozyme cleavage that rely on RNA extraction and reverse transcription may not reflect ribozyme activity in the original context.
Here, we develop an RT-qPCR method for measuring self-cleaving ribozyme activity in different contexts (Fig. 1B) and evaluate the validity of the method with RNAs produced by IVT for which we have direct orthogonal measurements of cleavage (Fig. 1C,D). Importantly, we find that RNA extraction and reverse transcription conditions can induce RNA sequences with ribozymes that did not cleave during IVT to self-cleave, resulting in incorrect ribozyme cleavage measurements with RT-qPCR. To circumvent this issue, we develop a workflow that prevents ribozyme cleavage during extraction and reverse transcription (Fig. 2A), which enables accurate ribozyme activity measurements with RT-qPCR. We validate our method on two HDV-like ribozymes (Webb and Lupták 2011) in eight genetic contexts, four of which do not cleave during IVT. We then apply the method to RNAs produced in Escherichia coli (E. coli) and identify context-dependent differences in activity compared to IVT. Our findings that sample preparation influences ribozyme activity measurements have broad implications for other ribozyme measurement techniques, particularly those that involve reverse transcription (Kobori et al. 2015; Vlková et al. 2021). These results are also important for characterization of DNAzymes (Zimmermann et al. 2020), riboswitches (Felletti and Hartig 2017; Dykstra et al. 2022), and ribozymes that perform reactions other than self-cleavage (Hedberg and Johansen 2013; Hausner et al. 2014; Hieronymus et al. 2022; Gambill et al. 2023; Kalvapalle et al. 2025). Together, these results provide a straightforward and accurate method for measuring ribozyme activity that should generalize to different ribozymes and riboswitches in diverse genetic contexts and transcription environments.
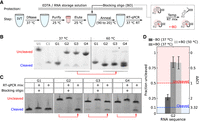
Identifying and preventing ribozyme cleavage during RNA purification and reverse transcription. (A) The workflow for preparing IVT RNA for RT-qPCR cleavage measurements. After DNA digestion, RNA is purified with buffers supplemented with EDTA to prevent cleavage (Materials and Methods). After RNA purification, a blocking oligonucleotide, termed BO, that is partially complementary to the ribozyme is added and annealed prior to RT-qPCR. The BO is designed to hybridize to the ribozyme and prevent it from adopting an active fold (right inset). (B) Denaturing gel electrophoresis results for RNAs after a 15 min incubation at 37°C or 60°C. Prior to this incubation, RNA was prepared by 30 min IVT at 37°C followed by a 30 min DNase I digestion at 37°C. U1 and C1 are uncleaved and cleaved control RNAs for G1, respectively. (C) Denaturing gel electrophoresis results for RNAs after a 10 min incubation at 37°C in RT-qPCR reaction mixture with or without BO. Prior to incubation, the RNAs were purified from IVT reactions and annealed with or without BO (Materials and Methods). In B and C, red arrows below the gel indicate undesired cleavage. G1 and G2 samples were on one gel and G3 and G4 samples were on another gel. The slower mobility of the gates with BO may be due to the transient binding of the oligo to the RNA. (D) RT-qPCR measurements of ribozyme cleavage for G2 RNA with and without BO with reverse transcription conducted at 37°C or 50°C. The ΔΔCt (Equation 2; Materials and Methods) and corresponding fraction uncleaved are labeled on the right and left axes, respectively. Error bars indicate standard deviation from three technical replicates.
RESULTS AND DISCUSSION
Overview of RT-qPCR method to measure ribozyme cleavage
Here we sought to use RT-qPCR to measure context-dependent ribozyme cleavage. To access the accuracy of such methods, we selected validation RNA sequences for which ribozyme cleavage activities in vitro had been previously measured using denaturing gel electrophoresis. Gel electrophoresis is an ideal orthogonal measurement for benchmarking because it does not require sample manipulation after IVT, the RNA is simply loaded on the gel for analysis. So, we take gel electrophoresis measurements as the ground truth for assessing the accuracy of RT-qPCR methods.
The validation sequences we selected are from the cotranscriptionally encoded RNA strand displacement (ctRSD) toolkit (Fig. 1B; Schaffter et al. 2023). ctRSD circuits are an emerging technology with potential applications spanning many environments, from cell-free biosensing (Jung et al. 2022) to cellular computation (Chappell et al. 2017; Green et al. 2017). In ctRSD circuits, gates containing HDV-like ribozymes are designed to fold and self-cleave during transcription (Fig. 1B). After ribozyme cleavage, gates can participate in strand displacement reactions programmed to process information (Schaffter and Strychalski 2022), so ribozyme activity is crucial for desired performance (Schaffter et al. 2023). Previously, a library of ctRSD gates in different genetic contexts with both efficient and poor ribozyme cleavage in IVT has been identified (Schaffter et al. 2023). For our validation RNAs, we selected six ctRSD gate sequences (G1–G6) with the same ribozyme sequence, a minimal version of the antigenomic HDV ribozyme (Schürer et al. 2002) that we term Ro. Three of these gates have genetic contexts in which Ro cleaves well (>75% as measured by gel electrophoresis) and three have genetic contexts in which Ro cleaves poorly (<25% as measured by gel electrophoresis) (Fig. 1C). In addition to the method validation RNAs, the ctRSD toolkit has characterized other ribozymes, such as the CPEB3 ribozyme (termed Rh in this study) (Webb and Lupták 2011), which also allows us to evaluate generalizability.
The RT-qPCR method we employed to measure ribozyme cleavage activity is based on relative quantification methods, analogous to ΔΔCt methods, developed previously (Bustin 2004; Kim et al. 2018; Vlková et al. 2021). In brief, two primer sets are used in these experiments, one set that spans the cleavage site and only amplifies uncleaved RNA (PCRu), and another set that bind downstream from the cleavage site and amplify both cleaved and uncleaved RNA (PCRo, Fig. 1B). The change in cycle threshold (Ct) of the two primer sets for an RNA of interest (G) relative to a control transcript without cleavage (U) is used to determine the fraction of uncleaved RNA in a given context (Materials and Methods). For simplicity, we implemented this method using a one-step RT-qPCR reaction with SYBR Green reporting.
We designed the PCRu and PCRo primer sets for RT-qPCR (Fig. 1D) to bind to regions of the ctRSD gates that did not vary from gate to gate so the same primers could be used for each genetic context of our validation RNAs. PCRu and PCRo were designed with different reverse transcription primers to keep the amplicon lengths below 150 bases (Udvardi et al. 2008). As a reference transcript for relative quantification, we used gates with a point mutation in the ribozyme sequence that renders it incapable of cleavage (U in Fig. 1D). To assess the accuracy of RT-qPCR measurements on our validation RNAs, we applied the following benchmarking metrics (Supplemental Section 3; Supplemental Fig. S14): sequences with >0.5 fraction uncleaved are considered poor cleavers, and sequences with <0.1 fraction uncleaved are considered good cleavers. From the gel electrophoresis results (Fig. 1C), the six validation RNAs fall into these two categories and these metrics align with previously developed fit-for-purpose heuristics for ctRSD circuits (Schaffter et al. 2023). Additionally, for primers with ∼100% amplification efficiency like those used in this study (Supplemental Sections 2.2, 2.3), a fraction uncleaved of 0.5 corresponds to a ΔΔCt of 1 (Equation 1, Materials and Methods), which is well within the sensitivity of RT-qPCR (Bustin 2004). In contrast, a fraction uncleaved of >0.75 corresponds to ΔΔCt values of <0.5, which is generally considered within the acceptable variability for technical replicates (Bustin 2004). So, we expect measurements of sequences for which most RNA is uncleaved to have large uncertainties, justifying the metric of >0.5 fraction uncleaved as the criteria for a poor cleaving sequence. On the other hand, for sequences for which most of the RNA cleaves, the ΔΔCt values should be >2 and less sensitive to experimental noise, thus justifying the metric of <0.1 fraction uncleaved as the criteria for a sequence that cleaves well.
Ribozyme cleavage during sample preparation confounds RT-qPCR measurements
To validate the RT-qPCR method for measuring ribozyme activity, we first produced the six validation RNAs by IVT and purified these RNAs for RT-qPCR. The six gate sequences in our validation RNAs contain the same ribozyme sequence but different upstream and downstream flanking sequences, which influence the ribozyme's activity when produced by IVT (Fig. 1D). Presumably, the G2, G3, and G4 sequences have adopted folds during IVT that disrupt the ribozyme structure and interfere with cleavage activity. These misfolded structures may be metastable, so we were concerned that RNA purification or subsequent reverse transcription could unintentionally induce ribozyme cleavage and result in incorrect measurements. To prevent ribozyme cleavage during RNA purification, we supplemented the RNA purification buffers with ethylenediaminetetraacetic acid (EDTA) to chelate magnesium (Fig. 2A), as magnesium is required for ribozyme activity (Ferré-D'Amaré and Scott 2010). We also confirmed that the DNase treatment we conducted directly after IVT did not change the ratio of uncleaved to cleaved RNA (Supplemental Fig. S15).
Many RT-qPCR protocols recommend a denaturing step at ≥65°C for RNAs with high GC content or strong secondary structure, and reverse transcription is often conducted at 42°C–60°C to promote destabilization of RNA secondary structure. Interestingly, we found that RNAs that did not cleave when produced by IVT at 37°C, could be induced to cleave completely when heated to 60°C for 10 min (Fig. 2B), and substantial cleavage was also observed at 45°C (Supplemental Fig. S16). The HDV ribozyme retains activity at high temperatures and under denaturing conditions (Smith and Dinter-Gottlieb 1991; Riccitelli and Lupták 2013), so increasing temperature may destabilize the interactions in G2, G3, and G4 that interfere with ribozyme folding, allowing the ribozyme to adopt a catalytically active conformation. Surprisingly, we also found that ribozyme cleavage could be induced for G2, G3, and G4 after purification when incubated for 10 min at 37°C in the RT-qPCR reaction mixture (Fig. 2C). This incubation mimics the reverse transcription step of RT-qPCR, and RT-qPCR measurements of G2 cleavage under these conditions resulted in <0.5 fraction uncleaved RNA, contrasting with our gel electrophoresis measurements (Fig. 2D).
To explore which components of the RT-qPCR reaction mixture could be inducing unintended ribozyme cleavage after purification, we incubated G2 with different combinations of RT-qPCR components. We found the RT-qPCR reaction buffer without reverse transcriptase or DNA polymerase was sufficient to induce cleavage of G2 at 37°C after RNA purification. Further, the addition of magnesium (to the concentration present in the RT-qPCR reaction mixture) to purified G2 in RNA storage solution also induced substantial cleavage (Supplemental Fig. S17). The addition of free magnesium exceeding the concentration in the RT-qPCR reaction buffer to G2 without purification directly after transcription did not change the cleavage observed (Supplemental Fig. S18). Together, these results suggest that the RNA changes conformation during the purification process and becomes capable of undergoing cleavage upon reintroduction of magnesium.
Based on the above results, we sought to prevent RNA from cleaving during the reverse transcription step of RT-qPCR. Adding EDTA to the RT-qPCR reaction mixture was not feasible, because free magnesium is required for reverse transcription and PCR (Bustin 2004). We opted to design a short DNA strand, termed a blocking oligonucleotide (BO), that could hybridize to the ribozyme sequence and prevent the ribozyme from folding into a catalytically active conformation (Fig. 2A, inset; Chadalavada et al. 2000; Kim et al. 2018; Chen et al. 2024). The BO was designed with 22 bases of sequence complementarity to the P2 helix of the ribozyme, a region necessary for cleavage (Supplemental Section 1; Riccitelli and Lupták 2013). Further, a 3′ amino modification was introduced to prevent the BO from being extended during RT-qPCR (Mizuno et al. 1999). After RNA purification, the BO was added to samples and a thermal annealing step was conducted to promote hybridization (Fig. 2A; Materials and Methods). We found a >200-fold molar excess of BO was able to prevent cleavage in the RT-qPCR reaction mixture (Fig. 2C; Supplemental Fig. S19). The high concentration of BO required could be due to the EDTA added to sequester magnesium, or the strong secondary structure of the HDV ribozyme (Duhamel et al. 1996). For G2 hybridized with BO, the RT-qPCR measurement of ribozyme cleavage yielded >0.75 fraction uncleaved RNA, which aligned with the expected results from denaturing gel electrophoresis measurements (Fig. 2D). With the BO included, RT-qPCR measurements of ribozyme cleavage yielded similar results for reverse transcription conducted at 37°C or 50°C (Fig. 2D), and the BO prevented G2 cleavage at 65°C (Supplemental Fig. S20). These results indicate the BO prevents ribozyme cleavage during reverse transcription to enable accurate RT-qPCR measurements, and this strategy is compatible with many RT-qPCR workflows.
Addition of a BO enables accurate RT-qPCR measurements of ribozyme cleavage in different genetic contexts
We next evaluated RT-qPCR measurements of ribozyme cleavage for the remaining five gate sequences from our validation RNAs (Fig. 1C) using the RNA purification method we developed with the BO (Fig. 2A). We conducted these experiments with a 37°C reverse transcription step and ran each sample in technical triplicate, with each experiment repeated twice using RNA produced by, and purified from, IVT reactions on separate days. Based on our benchmarking metrics (Supplemental Section 3), the fractions of uncleaved RNA for these gates from RT-qPCR aligned with our denaturing gel electrophoresis results, with G1, G5, and G6 cleaving well (<0.10 fraction uncleaved) and G2, G3, and G4 cleaving poorly (>0.50 fraction uncleaved) for both independent replicates of each gate (Fig. 3A).
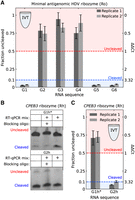
(A,C) RT-qPCR measurements of ribozyme cleavage for gates produced in IVT. In A, reverse transcription was conducted at 37°C. In C, reverse transcription was conducted at 50°C. ΔΔCt (Equation 2; Materials and Methods) and corresponding fraction uncleaved RNA are labeled on the right and left axes, respectively. Error bars indicate standard deviation from three technical replicates. Replicate 1 and replicate 2 indicate replicates from two IVT reactions and RNA purifications conducted on different days. (B) Denaturing gel electrophoresis results for Rh gates after a 10 min incubation at 37°C in RT-qPCR reaction mixture with or without BO. Prior to incubation, the RNAs were purified from IVT reactions and annealed with or without BO (Materials and Methods). G1h* RNA incubated at 50°C was similarly protected by the BO (Supplemental Fig. S21). Amplification curves and primer efficiency plots for (A) and (C) are presented in Supplemental Sections 2.4, 2.5.
We next explored how our workflow would transfer to a different ribozyme sequence. We selected the CPEB3 ribozyme, which is found in the human genome (Salehi-Ashtiani et al. 2006), as it has a similar double pseudoknotted fold to HDV ribozymes (Riccitelli and Lupták 2013). Further, this ribozyme has previously been shown to recover the cleavage activity of both the G2 and G3 sequences (Schaffter et al. 2023). To adopt our method to the CPEB3 ribozyme, which we term Rh, new primers and a new BO were designed to target similar regions of Rh as the regions targeted in Ro (Supplemental Section 1). We designed variants of the G1 and G2 gates with the CPEB3 ribozyme (G1h* and G2h), which had different context-dependent cleavage (Fig. 3B). G2h has previously been shown to cleave well in IVT by denaturing gel electrophoresis (Schaffter et al. 2023). We intentionally designed the G1h* sequence to have poor cleavage by changing the sequence directly downstream from the ribozyme to have complementarity with the P2 helix of Rh (Supplemental Section 1). With G1h*, we confirmed the BO sequence for Rh effectively prevented cleavage both in the RT-qPCR reaction mixture at 37°C (Fig. 3B, top) and at 50°C (Supplemental Fig. S21). We also tested RT-qPCR with reverse transcription at either 37°C and 50°C. RT-qPCR results were qualitatively similar at both temperatures (Supplemental Fig. S11), but 37°C reverse transcription resulted in a higher fraction of uncleaved RNA for G2h than expected, possibly due to differences in reverse transcription efficiency between U and G at the lower temperature (Supplemental Fig. S9). With 50°C reverse transcription, RT-qPCR measurements of Rh cleavage matched the expected cleavage based on denaturing gel electrophoresis measurements for G1h* and G2h (Fig. 3C). These results support the generality of adding a BO to enable correct RT-qPCR measurements of different ribozyme sequences, and suggest that higher reverse transcription temperatures may be necessary for certain sequences.
RT-qPCR measurements of ribozyme cleavage for RNAs produced in cells
Having applied our RT-qPCR method with the BO to eight different genetic contexts for RNAs produced by IVT (Fig. 3), we next explored using the method to measure ribozyme cleavage of gates produced in E. coli. For these experiments, we selected two gates that cleaved well when produced by IVT, G1 and G5, and two gates that cleaved poorly when produced by IVT, G2 and G3 (Fig. 3A). Each gate sequence was inserted into a plasmid downstream from a constitutively active T7 RNA polymerase (RNAP) promoter, and plasmids were individually transformed into E. coli BL21* (DE3). BL21* (DE3) can be induced to express T7 RNAP with isopropyl β-d-1-thiogalactopyranoside (IPTG) to drive transcription of the gates (Fig. 4A). Further, this strain has reduced RNase E activity, so it is often used for RNA expression studies (Green et al. 2017). For each gate sequence, we also created plasmids containing the uncleaved (U) control sequence and transformed those into E. coli BL21* (DE3) for relative quantification.
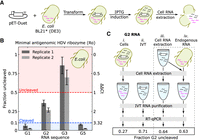
RT-qPCR measurements of ribozyme cleavage of gates produced in E. coli. (A) The workflow for expressing RNA in E. coli. Pink lines and gray lines inside cells indicate endogenous RNA and gate RNA, respectively. Gate sequences were cloned into a pET plasmid backbone and then transformed into E. coli BL21* (DE3). Cells cultured with IPTG express T7 RNAP, which transcribes the pET plasmid to produce gate RNA. Total cellular RNA was then extracted for analysis. (B) Fraction uncleaved RNA for gates with a minimal antigenomic HDV ribozyme produced in cells. Reverse transcription was conducted at 37°C. Error bars indicate standard deviation from three technical replicates. Replicate 1 and replicate 2 indicate replicates from two cell cultures and RNA extractions conducted on different days. Amplification curves and primer efficiency plots are presented in Supplemental Sections 2.4, 2.5. (C) Schematic of controls to evaluate whether the cell RNA extraction protocol influenced the ribozyme cleavage measurement. In sample iii, IVT RNA (gray) was taken through the entire cell RNA extraction protocol. In sample iv, cells without the plasmid were grown and lysed to yield endogenous RNA (pink), IVT RNA (gray) was added to the lysed cells, and the cell RNA extraction protocol was followed. The numbers in the box below the RT-qPCR arrow indicate the measured fraction uncleaved. Sample ii through sample iv were all >0.5 fraction uncleaved, as expected. Limitations with plate size prevented technical replicates in this experiment, but the expected standard deviation based on previous G2 technical replicates is approximately ±0.1. These results indicate cell RNA extraction or the presence of cellular RNA cannot account for the lower fraction uncleaved measured in sample i.
Cells were grown to log phase in media supplemented with IPTG, then pelleted and lysed to extract RNA. After extraction, the BO protocol was performed on total RNA prior to RT-qPCR. In E. coli, the G1, G3, and G5 sequences had similar cleavage as they did when produced by IVT reactions. G2, however, showed a lower fraction uncleaved when produced in E. coli (Figs. 3A, 4B). It is possible that the additional steps required to extract RNA from cells could confound the RT-qPCR measurement of G2. For example, cell lysis could induce cleavage, or the additional endogenous RNA present in the reaction (we used 50-fold more total RNA by mass from cells than from IVT) could interfere with RT-qPCR, or cause G2 to cleave. To assess these possibilities, we conducted control experiments in which G2 RNA produced by IVT was either taken through the full cell lysis and extraction protocol (Fig. 4C, sample iii) or added to total RNA extracted from E. coli lacking a gate plasmid (Fig. 4C, sample iv) prior to RT-qPCR. Both controls yielded fractions uncleaved of G2 >0.5 compared to a fraction uncleaved <0.3 for G2 produced in E. coli, suggesting G2 does indeed cleave to a greater extent in the cellular environment.
Enhanced ribozyme activity in cells, or environments mimicking the cellular cytoplasm, is often reported compared to activity in IVT reactions, possibly due to differences in ionic conditions or the presence of proteins (Herschlag et al. 1994; Brown et al. 2004; Ruminski et al. 2016; Yamagami et al. 2018, 2021). Of our validation RNAs, G2 was the most sensitive to changing conditions, showing substantial cleavage at lower temperatures (Supplemental Fig. S16) and cleaving to a greater extent in RT-qPCR reaction mixture without BO than G3 and G4 (Fig. 2C). It is also possible that differences in degradation rates between cleaved and uncleaved gates within cells influences the ratio of these products. These results show ribozyme cleavage can differ across both genetic and environmental contexts, highlighting the importance of accurate measurement techniques that can be applied across many applications.
Conclusion
Here, we developed an RT-qPCR-based method for measuring ribozyme cleavage in different genetic contexts and transcription environments and validated the method using orthogonal measurements of cleavage for RNA produced in vitro. The method we developed to prevent ribozyme cleavage with a BO during sample preparation and reverse transcription should be compatible with most RT-qPCR kits and protocols. We focused on a general one-step method with SYBR green reporting, but the BO method could be adopted for two-step protocols and other probe chemistries (Bustin 2004), or with digital droplet PCR if more sensitive measurements are required (Taylor et al. 2017). We also found the BO stabilized ribozymes at 65°C (Supplemental Fig. S20), indicating denaturation steps or higher reverse transcription temperatures could likely be used. However, we found assay performance could vary with different reverse transcription temperatures, depending on the primer set and ribozyme sequence (Supplemental Figs. S9, S11), so careful analysis and optimization are warranted when applying the method to new sequences.
Perhaps the most important finding in this study was that misfolded ribozymes with low catalytic activity could be induced to exhibit activity during RNA purification/extraction and reverse transcription, resulting in RT-qPCR measurements overestimating ribozyme activity in the absence of the BO. These results highlight the importance of validating new methods with orthogonal measurements. If we had not validated the RT-qPCR method on RNA produced by IVT and introduced the BO before applying the method to RNA produced in cells, we would have incorrectly observed substantial cleavage for G2, G3, and G4 in cells—an artifact of sample preparation. These findings have implications for other ribozyme cleavage measurements that require RNA purification/extraction and reverse transcription, such as RNA-seq (Kobori et al. 2015; Peach et al. 2015; Xiang et al. 2019; Espah Borujeni et al. 2020; Yokobayashi 2020; Olzog et al. 2021; Roberts et al. 2023). In particular, reports of context-dependent ribozyme cleavage that used different measurement techniques in vitro and in cells and found differences in activity may warrant additional examination (Roth et al. 2014; Vlková et al. 2021; McKinley et al. 2023). It is worth noting that HDV-like ribozymes are very stable and retain catalytic activity at high temperatures, so they may be uniquely susceptible to unwanted activity during sample denaturation and reverse transcription compared to other ribozyme folds (Duhamel et al. 1996; Webb and Lupták 2011).
More broadly, our findings suggest careful analysis of experimental design when applying any method for RNA analysis that requires RNA extraction or reverse transcription, particularly for structure and function analysis. For example, chemical probing techniques of RNA structure (Spitale and Incarnato 2023), such as selective 2′-hydroxyl acylation analyzed by primer extension sequencing (SHAPE-seq) or dimethyl sulfate probing followed by RNA sequencing (DMS-seq), require RNA extraction and reverse transcription. SHAPE-seq and DMS-seq methods are often conducive with chemical probing in situ (Watters et al. 2016; Zubradt et al. 2017; Smola and Weeks 2018), which should provide an accurate picture of the RNA structure irrespective of any rearrangements in subsequent extraction and reverse transcription. But these sequencing-based methods could also be used to obtain both the structure and catalytic activity of a ribozyme, and this could lead to erroneous results if ribozyme activity is not inhibited through cDNA synthesis. In the case of G2, the structure probing results would likely indicate that the ribozyme has adopted a nonnative fold, but the ribozyme cleavage results would indicate a high fraction of cleaved RNA, leading to the incorrect conclusion that the nonnative fold is catalytically active.
Based on the above observations, the BO method we developed should enable accurate measurements of RNA function for a broad range of methods and applications. We only studied ribozymes with HDV-like folds, but the method should apply to other ribozyme classes (Ferré-D'Amaré and Scott 2010), assuming a suitable BO can be designed. In fact, a similar technique has been demonstrated for the hammerhead ribozyme, although the BO was removed prior to reverse transcription (Kim et al. 2018), and hybridization of antisense oligos has been employed to prevent cotranscriptional cleavage of twister (McKinley et al. 2023), hairpin (Donahue and Fedor 1997), and HDV-like ribozymes both in vitro and in vivo (Chen et al. 2024). Our method could also be applied for measurements of aptazyme activity (Wieland and Hartig 2008; Nomura et al. 2013; Felletti and Hartig 2017; Dykstra et al. 2022), another important class of RNAs that often use context-dependent cleavage and could be susceptible to structural rearrangements during RNA extraction and reverse transcription. More generally, the method of blocking catalytic activity during sample preparation could be applied to other catalytic nucleic acids, such as ribozymes that perform ligation (Hedberg and Johansen 2013; Hausner et al. 2014; Hieronymus et al. 2022; Gambill et al. 2023; Kalvapalle et al. 2025) or DNAzymes (Zimmermann et al. 2020). One modification to our protocol that could help ensure successful application to other systems would be introducing the blocking oligo prior to DNase treatment to prevent any cleavage during that step of the protocol. It should be possible to use an RNA blocking oligo or a modified DNA oligo (Chen et al. 2024) that is not susceptible to DNase degradation. Although DNase treatment did not influence the results of our study, for either the IVT or cellular RNA protocols, other systems could be more sensitive. Alternatively, methods of RNA purification that do not require DNase treatment could be explored (Passalacqua et al. 2020; Han et al. 2021; Zhou et al. 2021; Đermić et al. 2023), providing these methods properly mitigate ribozyme cleavage. The set of validation RNAs presented in this study could be used to benchmark such alternative methods. Ultimately, accurate measurements of context-dependent RNA catalysis will support the discovery of new biology and innovations in RNA synthetic biology, biotechnology, and biomanufacturing.
MATERIALS AND METHODS
DNA and materials
DNA transcription templates were ordered as eBlock gene fragments from Integrated DNA Technologies (IDT). eBlocks arrived in 96-well plates eluted to 10 ng/µL in Buffer IDTE, pH 8.0. To meet the length requirements for ordering eBlock DNA, flanking sequences were appended adjacent to the sequence of the ctRSD gate amplified with PCR (see Supplemental Methods). DNA primers for PCR of transcription templates and RT-qPCR experiments were ordered from IDT without purification (standard desalting). The BOs were ordered from IDT without purification (standard desalting) and a 3′ amino modification to prevent extension. The pET-Duet-1 plasmid, used as the backbone for RNA expression in E. coli, was ordered from Millipore Sigma (71146-3).
All DNA sequences from this study are available in Supplemental File S1. Annotated DNA and RNA sequences are in Supplemental Section 1 (Supplemental Figs. S1, S2; Supplemental Tables S1, S2). Reagents used for specific techniques are specified in the relevant methods below. A full list of materials with vendors and catalog numbers is available in the Supplemental Methods.
PCR amplification of DNA
PCRs were conducted with 2× Phusion High-Fidelity Master Mix (Thermo Fisher F531L) and 0.5 µmol/L of each DNA primer. Amplification of linear DNA templates for IVT reactions was conducted with 0.02 ng/L of eBlock DNA and T7fwd and T7rev primers (Supplemental Table S2), with 30 cycles consisting of a 30 sec denaturing step at 98°C, a 30 sec primer annealing step at 60°C, and a 30 sec extension step at 72°C. A 3 min extension step at 72°C was executed at the end of the program. The same protocol was followed for the preparation of linear DNA inserts for cloning into plasmids but with ga4_fwd and pET_ds_rev primers (Supplemental File S1). Amplification of the pETDuet-1 backbone was conducted with 0.2 ng/µL of plasmid DNA and the pET_BB_ds_fwd and pET_BB_rev_ga4 primers (Supplemental File S1), with 30 cycles consisting of 30 sec denaturing step at 98°C, a 30 sec primer annealing step at 62°C, and a 2 min extension step at 72°C. A 5 min extension step at 72°C was executed at the end of the program. Following PCR, samples were purified with a QIAquick PCR Purification Kit (Qiagen 28104), eluted in Qiagen Buffer EB (10 mmol/L tris-HCl, pH 8.5), and measured with absorbance at 260 nm on a DeNovix D-11 Series Spectrophotometer.
Gel electrophoresis
RNA gel electrophoresis experiments were conducted with 4% agarose EX E-gels. These gels come prestained with SYBR Gold for fluorescence imaging. Electrophoresis was conducted on an E-Gel powerbase (Thermo Fisher G8200), and E-gels were imaged using a FAS-Digi PRO system equipped with a blue-green light source (470–520 nm) and Canon 250D camera (Nippon Genetics). For denaturing gels, a solution of 100% formamide and 36 mmol/L EDTA was mixed 1:1 by volume with the samples, and the samples were heated to 85°C for 5 min before electrophoresis. The samples were immediately loaded on gels and run for 30 min before imaging. We confirmed that the results from our denaturing agarose E-gels agreed with the results of polyacrylamide gel electrophoresis with 7 M urea (Supplemental Fig. S13). Gel images were not postprocessed; any brightness and contrast adjustments were applied uniformly across each image during image acquisition. Unless otherwise stated, white spaces between gel images represent images taken from different gels. Each gel had size markers, the uncleaved (U), and cleaved (C) controls, which were used to align gel images.
RNA production and purification from IVT
To prepare IVT RNA for RT-qPCR, 25 nmol/L of DNA template was transcribed at 37°C for 1 h in transcription buffer prepared in house (40 mmol/L tris-HCl [pH 7.9], 6 mmol/L MgCl2, 10 mmol/L dithiothreitol, 10 mmol/L NaCl, and 2 mmol/L spermidine) supplemented with 1 U/µL of T7 RNAP (Thermo Fisher EP0113) and with 2 mmol/L of each NTP (Thermo Fisher R0481). These conditions were used for all DNA templates other than G2h and U2h, for which 100 nmol/L of DNA template and 10 U/µL of T7 RNAP were used. Following transcription, 3.33 U/µL of DNase I and DNase reaction buffer (Thermo Fisher EN0523) were added, and samples were incubated at 37°C for 30 min. RNA was then purified with an RNA Clean & Concentrator Kit (Zymo Research R1016), with the RNA-binding buffer supplemented with 36 mmol/L of EDTA and without the prep buffer step. RNA was eluted in TE buffer (Thermo Fisher AM9849) and immediately mixed with an equal volume of RNA storage solution (1 mM sodium citrate, pH 6.5) (Thermo Fisher AM7001). RNA concentrations were determined with a Qubit using an RNA Quantification High Sensitivity Quantification Kit (Thermo Fisher Q32852). If not used immediately, RNA samples were stored at −80°C. A step-by-step RNA extraction protocol is in the Supplemental Methods.
Plasmid assembly and cloning
Plasmids were assembled with Gibson Assembly (Gibson et al. 2009) using 30 base homology domains. After PCR and cleanup, the plasmid backbone was subsequently digested with a volume fraction of 4.3% FastDigest DPNI (Thermo Fisher FD1703) for 1 h at 37°C and then purified with a QIAquick PCR Purification Kit. Backbone and insert DNA were then mixed to the same final mass concentrations (∼15 ng/µL each) with 2× Gibson Assembly mix (New England Biolabs E2611L) and incubated at 50°C for 1 h. These samples were then transformed into electrocompetent DH5α cells prepared in house (derived from Thermo Fisher 18265017) and grown overnight on Luria broth (LB, Thermo Fisher BP1426) agar plates supplemented with 100 µg/mL ampicillin (Millipore Sigma A9518-25G). The next day, colony PCRs of single colonies were conducted with sequencing primers (pET_seq_fwd and pET_seq_rev, Supplemental File S1) and PCR products with the correct insert size from gel electrophoresis were sequence verified with Sanger sequencing. Colonies with sequence verified plasmids were then grown overnight in 3 mL of LB supplemented with 100 µg/mL ampicillin. Plasmids were extracted from overnight cultures using a Qiagen Spin Miniprep kit (27104), and these plasmids were then transformed into electrocompetent BL21 Star (DE3) cells prepared in house (derived from Invitrogen C601003). Electrotransformations were conducted with MicroPulser Electroporation Cuvettes, 0.2 cm gap (BioRad 1652086) using an Eporator (Eppendorf 4309000027).
RNA production and extraction from E. coli
BL21 Star (DE3) cells transformed with a pET plasmid encoding for a gate sequence with a constitutive T7 promoter were grown at 37°C overnight in 3 mL of LB supplemented with 100 µg/mL ampicillin. Overnight cultures were diluted 100-fold into 10 mL of LB supplemented with 100 µg/mL ampicillin and 100 µmol/L of IPTG and subsequently grown at 37°C until the culture reached an optical density at 600 nm of 0.5–0.8 (∼6 h). Optical density measurements were conducted on a Genesys 30 Visible Spectrophotometer (Thermo Fisher 840-277000). One and a half mL of culture was then mixed with twice the volume of RNAprotect Bacteria Reagent (Qiagen 1018380). Cells were then pelleted, resuspended in 0.1 mL of 50 mmol/L of EDTA (pH 8.0), and lysed with 1 mL of TRI reagent (Zymo Research R2050). Total RNA was extracted using chloroform separation and ethanol precipitation and subsequently purified using Zymo-Spin IIICG columns (Zymo Research C1006-50-G) and wash buffer (Zymo Research C1001-50). Purified RNA was eluted in nuclease-free water (Ambion AM9938) and incubated for 30 min at 37°C with 4.17 U/µL of DNase I in DNase Reaction Buffer (Thermo Fisher EN0523). Samples were then purified as in “RNA production and purification from IVT.” If not used immediately, RNA samples were stored at −80°C. A step-by-step protocol is in Supplemental Methods.
Preventing ribozyme cleavage with BOs
After purification, 14 µL mixtures of RNA and BOs were prepared in RNA storage solution to a final concentration of 8.6 ng/µL for IVT RNA or 17.1 ng/µL for E. coli total RNA and 157 µmol/L of BO. For IVT gate RNA, this corresponds to a ∼1000-fold molar excess of blocking oligo to RNA. These samples were then heated to 90°C for 5 min and subsequently cooled to 20°C at a rate of −1°C per minute. Samples were diluted to 1 ng/µL in RNA storage solution with concentrations verified with a Qubit using an RNA High-Sensitivity Quantification Kit (Thermo Fisher Q32852). Gate (G), uncleaved (U) control, and cleaved (C) control samples were prepared with BO prior to RT-qPCR. A step-by-step protocol is in Supplemental Methods.
RT-qPCR experiments
RT-qPCR experiments were conducted using a SuperScript III Platinum SYBR Green One-Step Kit (Thermo Fisher 11736059) in an Applied Biosystems ViiA 7 Real-Time PCR System. RT-qPCR reactions contained a final concentration of 3 mmol/L of MgSO4, 0.2 mmol/L of each dNTP, 50 nmol/L of ROX reference dye, and 0.2 μmol/L of forward and reverse primers. A final concentration of 0.08 pg/µL or 4 pg/µL of RNA with BO was used for IVT RNA or E. coli total RNA, respectively. RT-qPCR experiments were initiated with a 10 min reverse transcription step. Unless otherwise stated, the reverse transcription step was conducted at 37°C for sequences with Ro and 50°C for sequences with Rh. Samples were then heated to 95°C for 5 min, followed by 40 cycles of a 15 sec denaturing step at 95°C and a 60 sec annealing/extension step at 60°C. Fluorescence readings were taken during the annealing/extension step of each cycle. This was followed by a 60°C–95°C temperature increase for melt curve analysis.
For a given gate sequence, samples with the gate (G) RNA and samples with the corresponding uncleaved (U) control RNA were prepared with either the PCRu or PCRo primer sets (Supplemental File S1). Experiments were conducted with three technical replicates, making a minimum of 12 samples for a given sequence. Most experiments also included samples for a dilution series of the relevant uncleaved (U) control RNA to assess primer amplification efficiency, a sample with the relevant cleaved (C) control RNA, a no template control, and a no reverse transcriptase control. A plate layout (Supplemental Fig. S3) with descriptions is in Supplemental Section 2.1.
From melt curve analysis and gel electrophoresis, we confirmed PCRu and PCRo primers yielded single DNA products of expected size. We also confirmed that no template and no reverse transcription controls did not have amplification within 10 cycles of our measurements. See Supplemental Section 2.3 (Supplemental Figs. S4–S6). Lastly, we confirmed that the presence of the BO did not influence the RT-qPCR results (Supplemental Fig. S7).
RT-qPCR data analysis
In each experiment, the Ct value was manually adjusted in Applied Biosystems ViiA software and applied to all samples on the plate. The thresholds used for each experiment are in the uploaded data files and shown in amplification curves in Supplemental Section 2.5. Data were exported as Excel files and analyzed with custom Python code (Python 3.8.18, Spyder 5.4.3).
Using a relative quantification technique typically termed the ΔΔCt method (Supplemental Section 2.2; Supplemental Table S3; Bustin 2004; Kim et al. 2018; Vlková et al. 2021), the fraction of uncleaved gate for a given sequence was calculated with Equation 1. The ΔΔCt value is the difference between the ΔCt of U and G for PCRu and the ΔCt of U and G for PCRo (Equation 2). Because the PCRu primers only amplify uncleaved products, ΔCtPCRu indicates the concentration difference in uncleaved RNA between the U and G samples. Because the PCRo primers amplify both
uncleaved and cleaved, ΔCtPCRo accounts for any differences in the total concentration of U and G RNA added in an experiment (Fig. 1B).
 (1)
(1)
 (2)
where
(2)
where  indicates the mean of three technical replicates.
For the above analysis to be valid, PCR amplification efficiencies should be between 90% and 110% (Pfaffl 2001). Using a dilution series of U control RNAs, we verified that the PCR amplification efficiencies for PCRo and PCRu primers ranged between 94% and 106% across sequences and replicates from independent RNA extractions. Further, the average amplification efficiency of the PCRu primers across gate sequences and replicates was 100%, justifying the use of Equation 1. See Supplemental Sections 2.4, 2.5 (Supplemental Figs. S8–S12). Further, reverse transcription efficiency for PCRo cannot vary substantially between the G and U samples of a given sequence, otherwise this PCR cannot be used to control for differences in concentration between the samples, as the two samples would have different Ct values at the same concentration. We found the amplification curves from PCRo for U, C, and G RNAs were nearly identical for most sequences; see Supplemental Sections 2.4, 2.5 (Supplemental Figs. S8, S9). For Rh sequences, we found reverse transcription efficiencies appeared to differ for U and G RNAs at 37°C but not at 50°C (Supplemental Figs. S9, S11), so we used 50°C reverse transcription for these experiments. Reverse transcription temperatures should be tested for each new ribozyme sequence or primer set.
Error bars
Uncertainty in Ct measurements was obtained by calculating the standard deviation of the mean Ct values from three technical
replicates for each sample. These errors were then propagated to ΔCt and ΔΔCt using Equation 3, and the final error in measured fraction uncleaved was estimated using Equation 4 (Bustin 2004; Taylor 2022). Step-by-step error propagation is in Supplemental Section 2.2.
 (3)
(3)
 (4)
where σ indicates standard deviation and σA−B indicates standard deviation of ΔCt or ΔΔCt.
(4)
where σ indicates standard deviation and σA−B indicates standard deviation of ΔCt or ΔΔCt.
DATA DEPOSITION
All MIQE information is provided in the associated methods, protocols, supplemental files, and associated data files. The primer and transcription template sequences used in this study are in Supplemental File S1. The full plasmid sequences for the experiments in E. coli are in Supplemental File S2. Uncropped gel images and RT-qPCR data along with the Python analysis code for producing the figures are in Supplemental File S3 (available at https://zenodo.org/records/14918362).
COMPETING INTEREST STATEMENT
S.W.S. has intellectual property related to cotranscriptionally encoded RNA strand displacement circuits (International application number: PCT/US2022/053229). The authors declare no other competing interests.
SUPPLEMENTAL MATERIAL
Supplemental material is available for this article.
ACKNOWLEDGMENTS
The authors would like to thank Jason Kralj, David Ross, Elizabeth Strychalski, Molly Wintenberg, and Christina Bergonzo for insightful discussions throughout the project and manuscript preparation. This work was supported by a National Research Council Postdoctoral Fellowship to S.W.S. Certain commercial entities, equipment, or materials may be identified in this document to describe an experimental procedure or concept adequately. Such identification is not intended to imply recommendation or endorsement by the National Institute of Standards and Technology, nor is it intended to imply that the entities, materials, or equipment are necessarily the best available for the purpose. Official contribution of the National Institute of Standards and Technology; not subject to copyright in the United States.
Author contributions: S.W.S. conceived the project, designed experiments, and conducted data analysis. N.Y.A. designed and conducted RT-qPCR experiments. O.B.V. conducted plasmid cloning experiments. S.W.S. wrote the manuscript with input from all authors.
Footnotes
-
Article is online at http://www.rnajournal.org/cgi/doi/10.1261/rna.080243.124.
- Received August 23, 2024.
- Accepted February 19, 2025.
This is a work of the US Government.




