


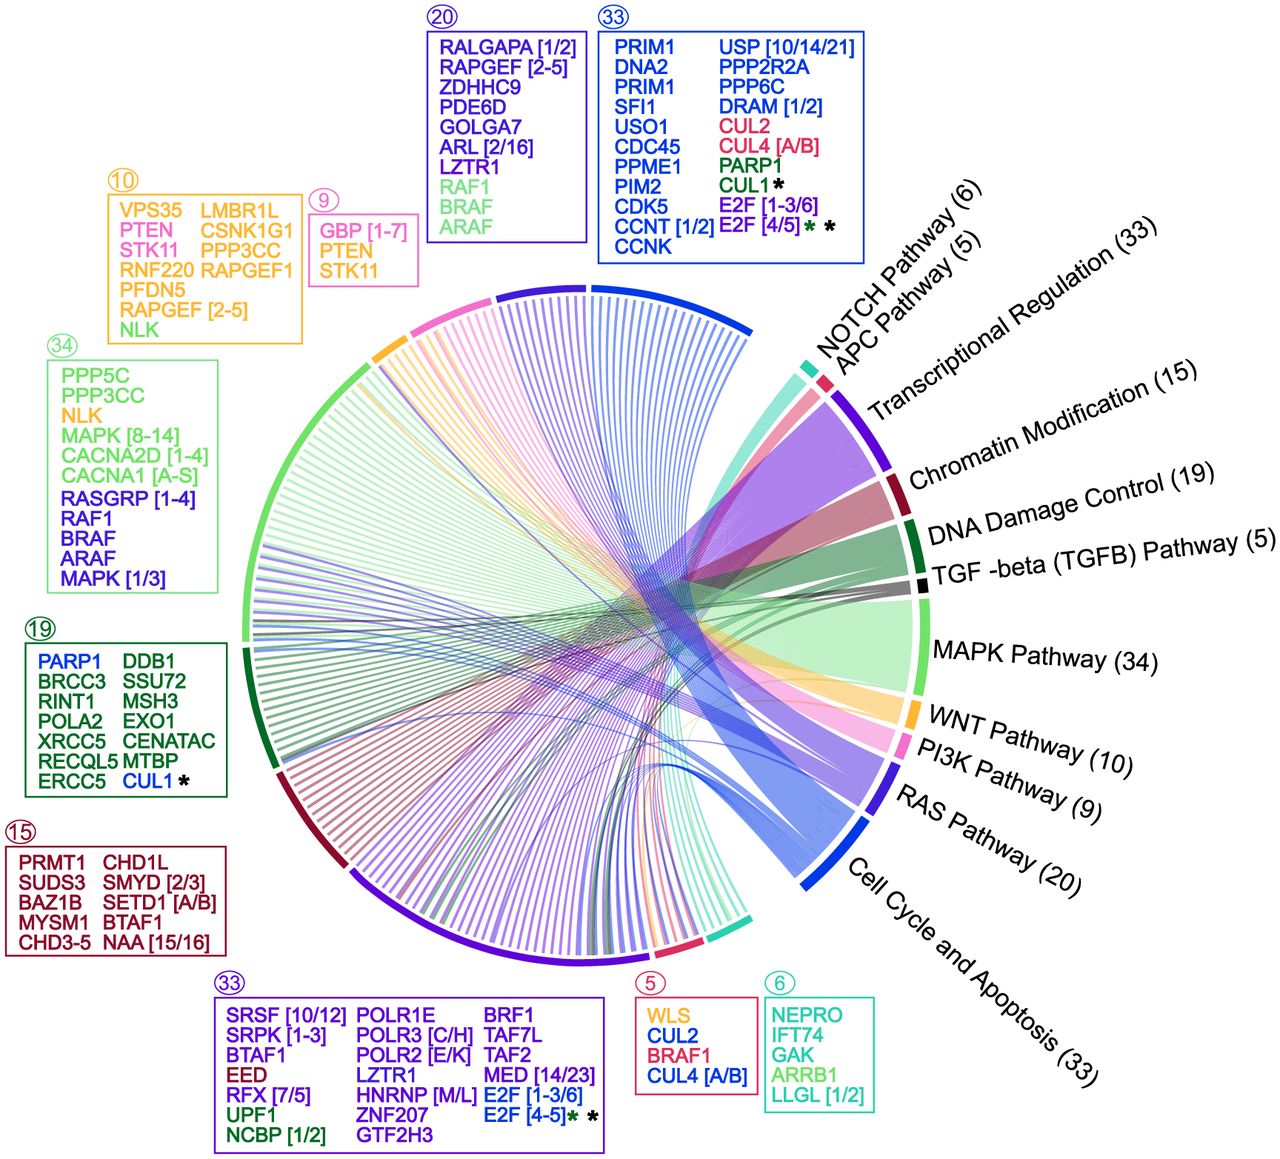
The distribution and network of 152 MIGs across growth-associated pathways. The MIG distribution across pathways was analyzed using DAVID (Sherman et al. 2022). The pathways are depicted on the right as arches and genes on the left side of the diagram. Each arc is color-coded, and its length is proportional to the number of MIGs associated with that pathway. Boxes on the left list the genes belonging to each pathway, their color matching the main pathway they are part of. The numbers above the boxes indicate the total number of genes. The genes inside the boxes are also colored according to their main pathways. Genes present in more than two pathways are indicated with color-coded star symbols (★). Numbers in brackets represent gene families.




