


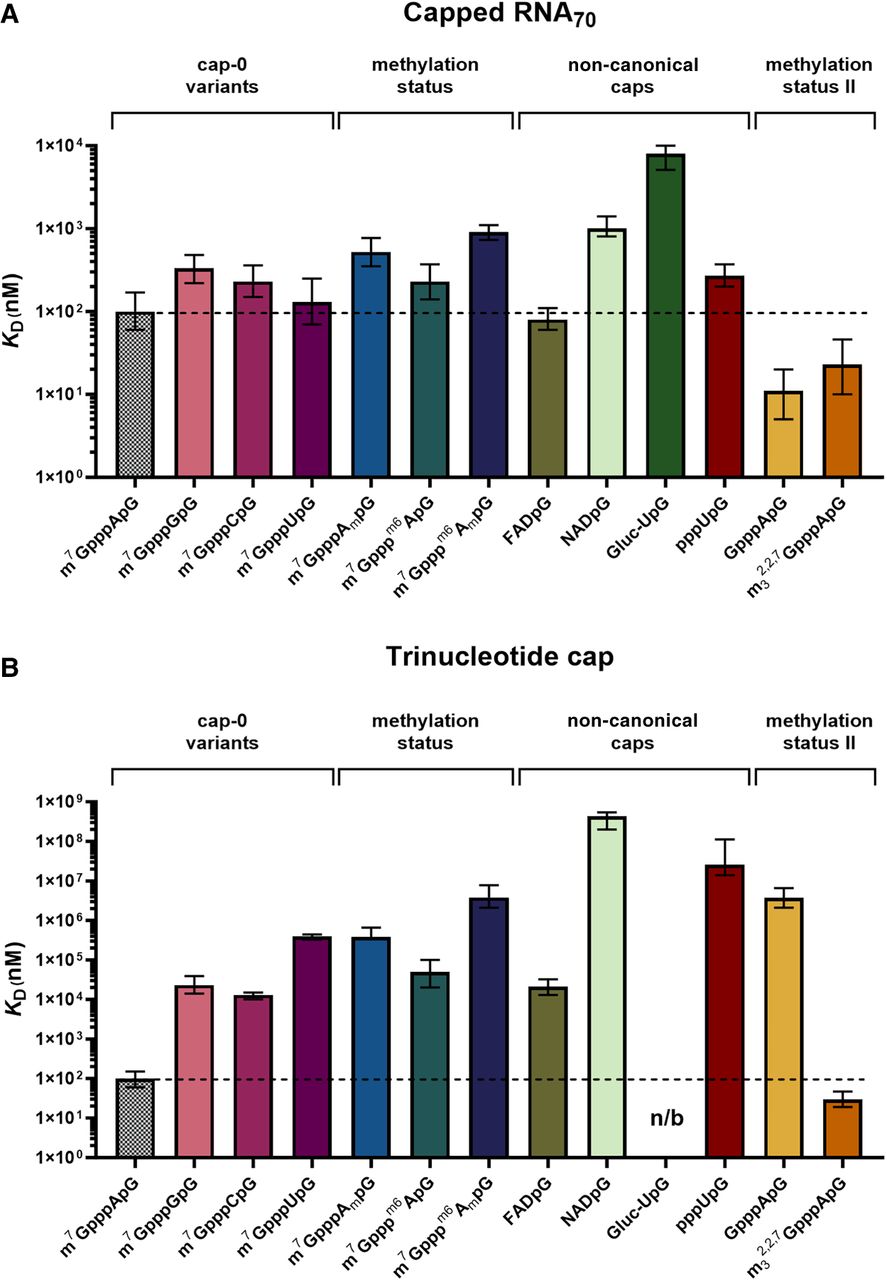
FIGURE 4.
Comparison of KD values for different IFIT1 ligands. (A) Capped 70 nt RNAs. (B) Free cap structures. Data shown are mean values from minimum three replicates with confidence intervals. (n/b) No binding was observed at the studied concentration range.




