


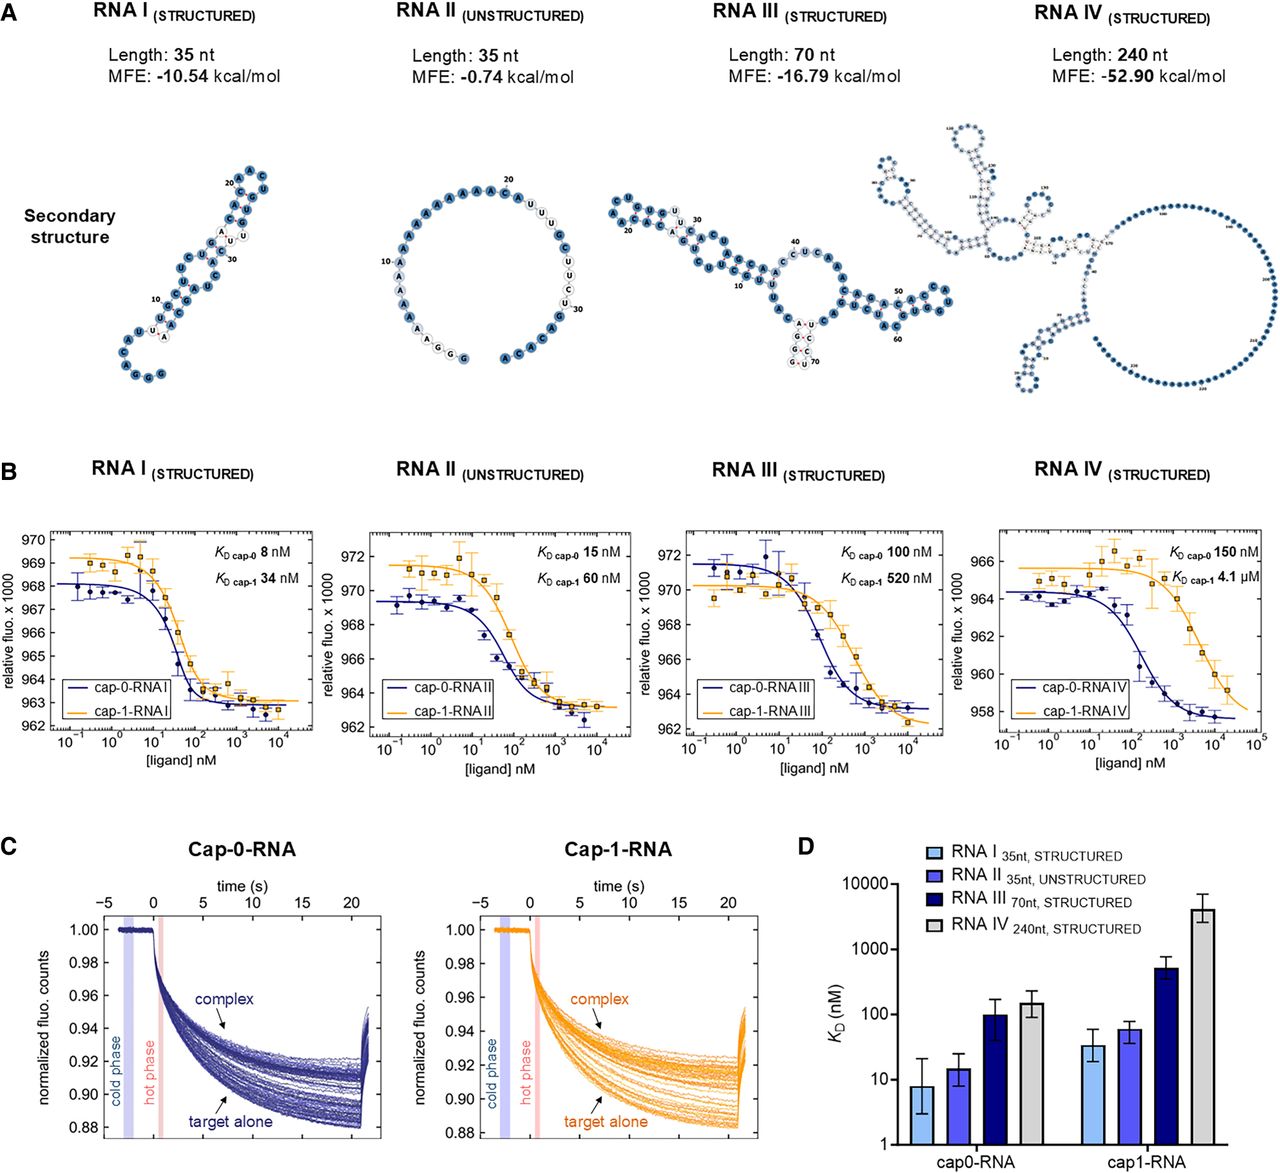
Determining KD values for four different sequence variants of cap-0 and cap-1 RNA using the MST method. (A) Predicted secondary structures of the analyzed RNA sequences (model Vienna RNAfold) and their MFE (minimum free energies). (B) The determined MST-binding curves from triplicate experiments (data points represent mean values ± SD). Binding curves are best fits for 1:1 binding model. (C) Representative MST traces for two of the curves shown in B (RNA III). Vertical marks (blue and red highlights) indicate cold and hot regions that were used for further analysis (Tjump). (D) Comparison of the determined KD values (mean values from triplicate experiments with confidence intervals).




