


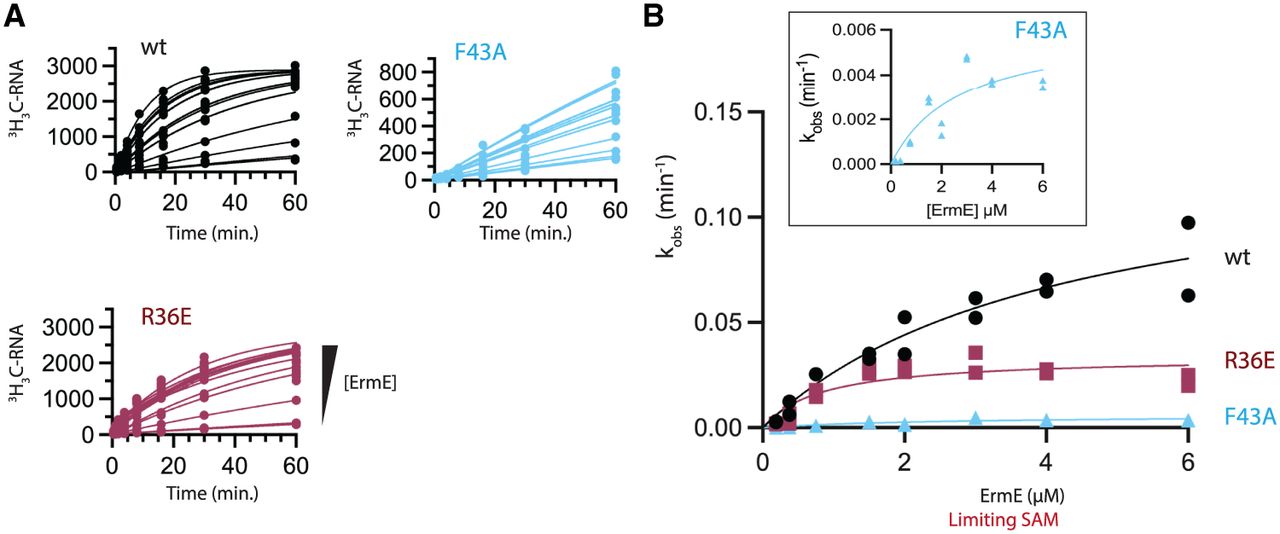
FIGURE 5.
Single turnover kinetics. (A) Methylated RNA versus time plots for increasing concentration of wild-type (wt) ErmE and site-directed mutants. (B) Methylation rates (kobs) are plotted versus ErmE concentration under limiting SAM and excess RNA conditions and fit to a model for single-turnover kinetics to extract kchem and K1/2,SAM values. An inset is shown of the F43 data with a y-axis range of 0–0.006 min−1.




