


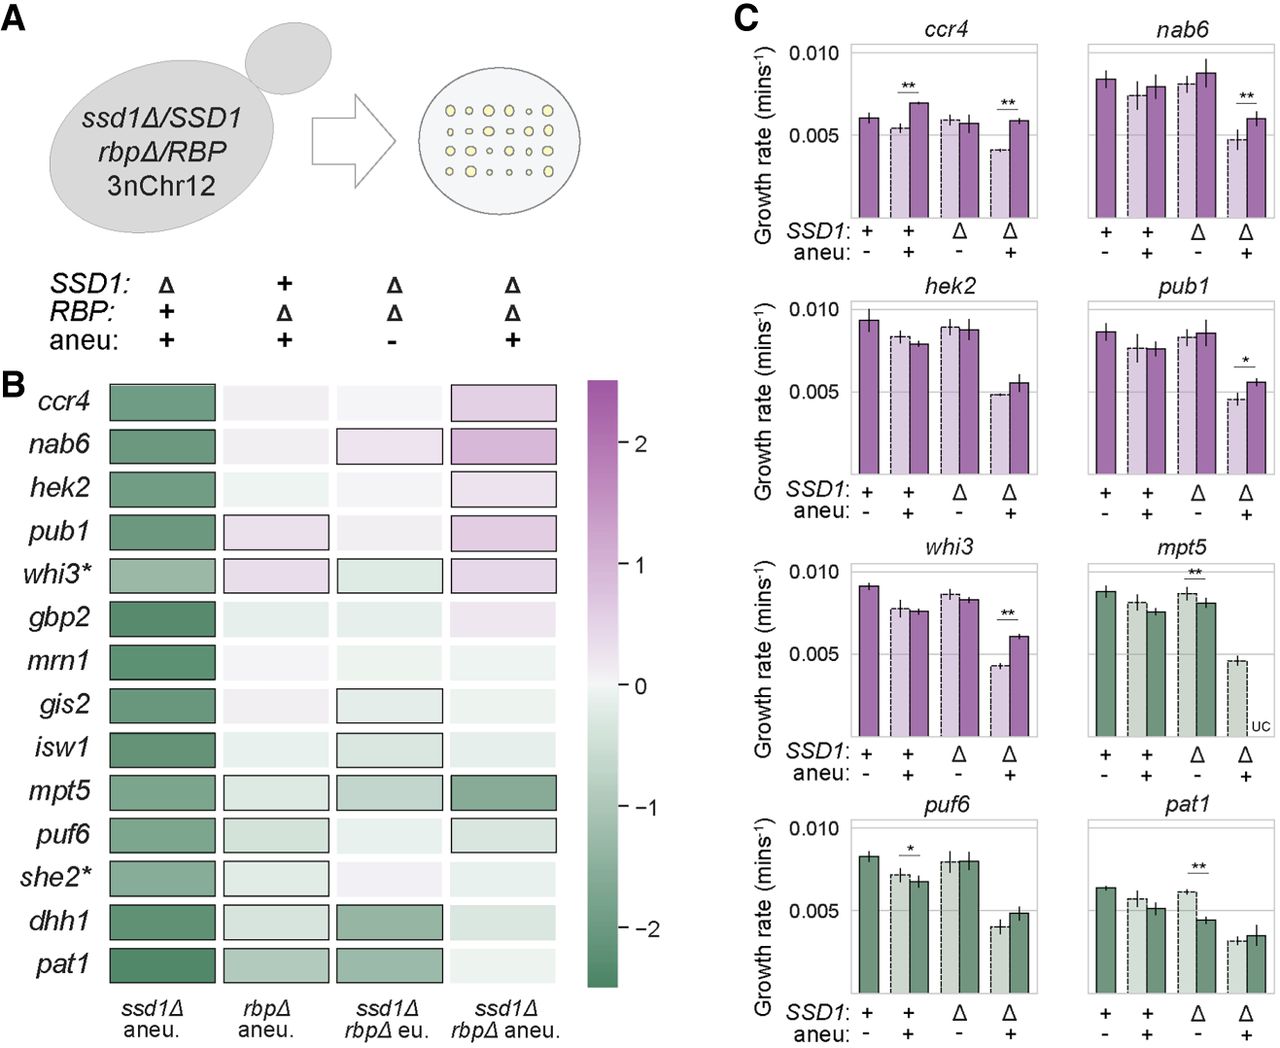
RBPs with shared targets exhibit synthetic genetic interactions with ssd1Δ and aneuploidy. (A) Dissection of a parent strain trisomic for chromosome 12 (3nChr12) and hemizygous at SSD1 and each RBP locus of interest yields colonies with all possible genotypes, a subset of which are represented in B. (B) The log2(fold-difference) in colony size comparing mean observed size versus mean expected size across batches (see Materials and Methods), according to the color scale, for genotypes indicated along the top in A. Black outlined boxes identify significant effects (FDR ≤ 0.05). Asterisk indicates haploids. (C) Average and standard deviation of exponential growth rates of the denoted strains under standard conditions; all strains that are shown for each mutant lack the RBP in question. Measured growth rates are represented as solid bars; expected growth rates are represented by light colors and dashed outlines. The average growth rate of the wild-type parent is 0.0081 min−1. Mutants with primarily a positive (alleviating) effect are shown in purple; mutants that mostly exacerbated defects are shown in green. (**) P-value ≤ 0.01, (*) P ≤ 0.05, (+) P ≤ 0.1, two-tailed, replicate-paired t-test comparing observed versus expected values. (UC) Unculturable strain.




